Sentiment Analysis on Social Media Platforms Using Python
In this modern day and age, data is an asset to individuals and organizations. You might have heard this term, Big Data, as one of the hottest topics in the tech industry. But what does it mean? Big Data refers to the flow of data, received or stored, in large volumes. It can be any form of data such as text, documents, audio, images, videos, etc. Many companies rely heavily on data-driven products today. Nearly every division in a company utilizes data analysis (leading to sentiment analysis) skills to its advantage. For instance, a company can launch its carpool ride application based on the data from existing ride apps and use them to target the market gap effectively. In addition, they can optimize existing products to increase their sales.
Importance of Data Analysis in 2023 and Beyond

Data Analysis has several applications. In this article, we will be discussing one of its applications, sentiment analysis on social media platforms, using Python which falls under the category of Natural Language Processing (NLP) because we will be dealing with human language that the machine will interpret. Here we will be using Twitter API with Python to gather tweets and perform analysis on the retrieved data.
Since it is the era of digital technology, people prefer to use social media apps for information, like finding out the reviews of a restaurant. Therefore, effective data science functions can classify people’s sentiments (for sentiment analysis) and feelings based on how they express themselves on social media.
Similarly, using scientific methods, processes, and algorithms, we can use data analysis skills to extract the feelings behind a tweet. It is vital as the categorization of emotions can play a key role in various sentiment analysis domains. For example, with the help of people’s emotions, the commercial industry can receive feedback on a newly launched product, which can be considered while improving their products in response to those feelings.
So, without wasting time on more mumbo jumbo (no, but seriously, you needed that introduction to catch up), let’s jump right into it!
Why Choose Python for Sentiment Analysis
Python is an open-source language with a strong community. It is an ideal language to learn due to its simplicity and readability. In addition, it also has a low learning curve, allowing you to focus on actual coding rather than getting your head around the language’s syntax. Pretty useful — from my own experience.
NumPy, Pandas, and Matplotlib are just a few of the many Python libraries available for use in various contexts. For instance, data analysis, data visualization, statistics, mathematics, machine learning, and natural language processing.
Necessary Python Libraries for Sentiment Analysis
You can use Python versions 3.7 and above. You will need these libraries for following this guide on sentiment analysis in Python:
To install nltk, run this command in the terminal:
pip install nltkTo install wordcloud, run this command in the terminal:
pip install wordcloudTo install numpy, copy this line to your terminal:
pip install numpyTo install tweepy, run the following command in the terminal:
pip install tweepyTo install seaborn, run this command:
pip install seabornTo install json, run the following command in the terminal:
pip install jsonTo install pandas, run the following command in the terminal:
pip install pandasTo install requests, run the following command in the terminal:
pip install requestsTo install re, run the following command in the terminal:
pip install regexTo install matplotlib, run the following command in the terminal:
pip install matplotlibTo install textblob, run this in the terminal:
pip install textblobNow that all our installation is complete. Let’s start coding!
Importing the Necessary Python Libraries for Sentiment Analysis on Social Media Platforms
You must import the libraries installed above in your project like this:
import nltk
nltk.download('averaged_perceptron_tagger')
nltk.download('punkt')
nltk.download('stopwords')
from nltk import pos_tag, word_tokenize, RegexpParser
from wordcloud import WordCloud, STOPWORDS, ImageColorGenerator
import matplotlib.pyplot as plt
import requests
import re
import numpy as np
import tweepy as tw
import seaborn as sns
import json
import pandas as pd
from textblob import TextBlob
After that, we will perform sentiment analysis using the following libraries above. We will use Tweepy, an open-source Python package that allows access to the Twitter API easily.
Note: I have created a Github link with access to all the code I have used in this post. You can head over to quickly see what this article will look like and also be able to understand it better. I suggest you follow along to make the most of this post.
Step 1: Get Twitter API Access
For using Tweepy, you need to create a Twitter Developer account to obtain API keys and access tokens.
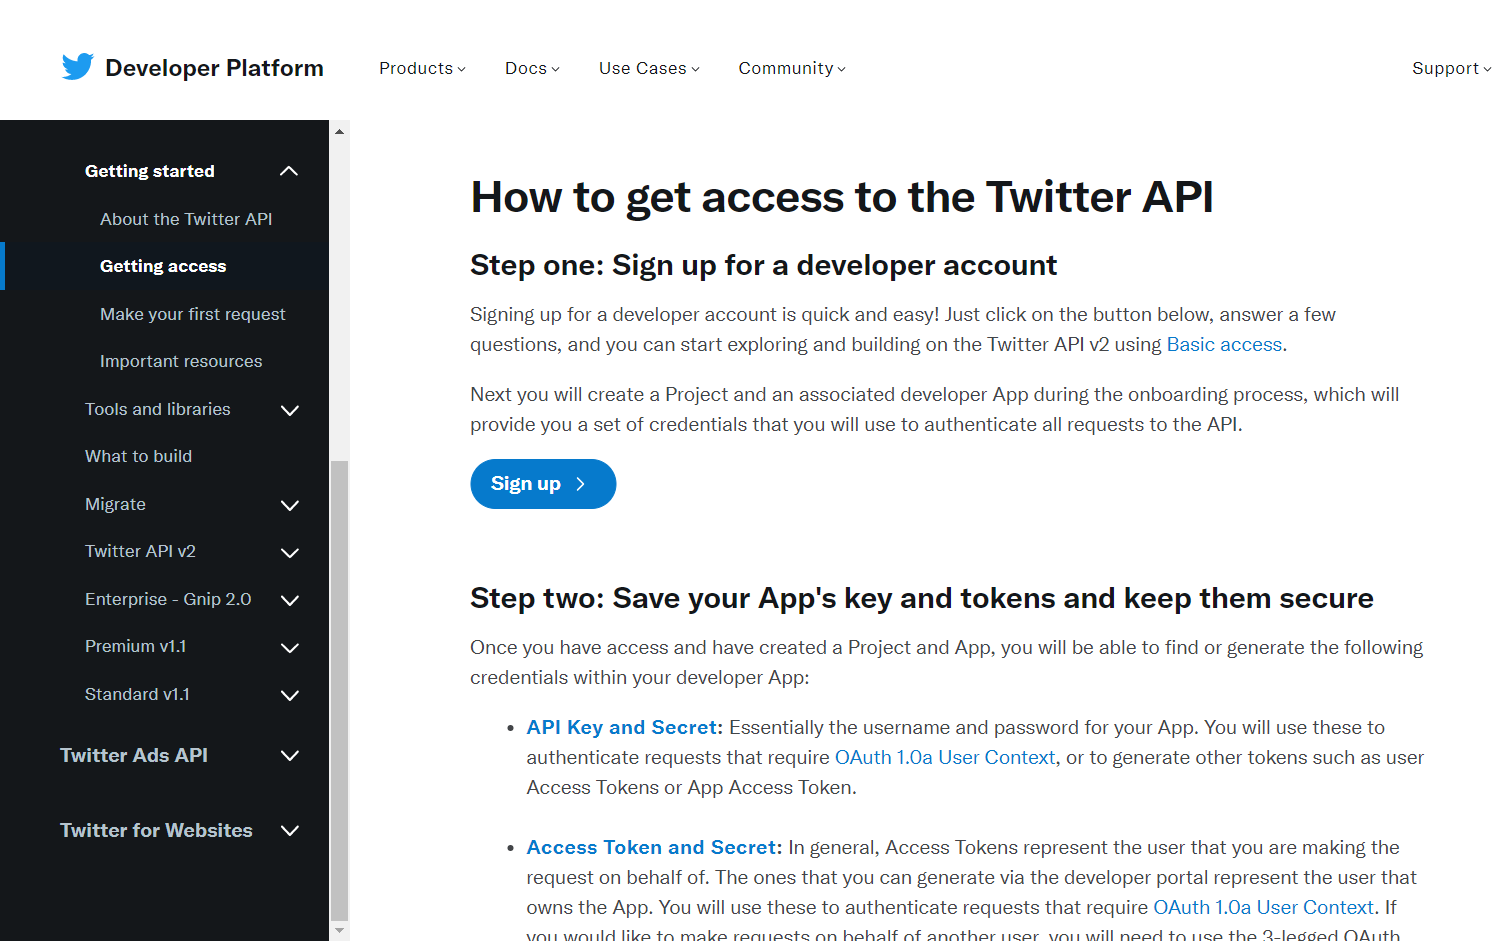
Once you sign up for a developer account, you can access the API key, secret, and tokens.
Use the code below to get user auth, replacing the values with your own.
#Getting authorization
consumer_key = 'Add_your_consumer_key_here'
consumer_key_secret = 'Add_your_consumer_key_secret_here'
access_token = 'Add_your_access_token_here'
access_token_secret = 'Add_your_access_token_secret_here'
auth = tw.OAuthHandler(consumer_key, consumer_key_secret)
auth.set_access_token(access_token, access_token_secret)
api = tw.API(auth, wait_on_rate_limit=True)
When a user authorizes an app, the app is granted permission to access the user’s account using their access token and secret. The app then includes these access credentials in every request made to the Twitter API to prove that it has permission to access the user’s account.
Step 2: Retrieve the Number of Tweets from any Twitter Hashtag
Then, using this API, you can access ~1000 tweets over any desired hashtag.
For example, I have chosen #DonaldTrump. Hence, you can perform sentiment analysis on any hashtag of your choice.
The cursor method handles the pagination behind the scenes.
# Create a custom search term and define the number of tweets
search_term = "#DonaldTrump -filter:retweets"

tweets = tw.Cursor(api.search_tweets,
                  q=search_term,
                  lang="en",
                  since_id='2023-04-04').items(1000)
searched_tweets = [t for t in tweets]
The list, searched_tweets, will have the first 1000 tweets tweeted since 4th April 2023 (as specified in the “since_id”. In addition, the tweets will have uncleaned data (I will show you how to filter out below). This is necessary to be put into a proper format for data analysis.
Step 3: Data Cleaning in Python
Next, create a text file named tweet_json_FM_data to dump the 1000 tweets. After that, create a pandas data frame to use for sentiment analysis:
def remove_url(txt):
    #Replace URLs found in a text string with nothing
    return " ".join(re.sub("([^0-9A-Za-z \t])|(\w+:\/\/\S+)", "", txt).split())

#Removing @ handle
def remove_pattern(input_txt, pattern):
    r = re.findall(pattern, input_txt)
    for i in r:
        input_txt = re.sub(i, '', input_txt)

    return input_txt

tweet_dataset['text'] = np.vectorize(remove_url)(tweet_dataset['text'])
tweet_dataset['text'] = np.vectorize(remove_pattern)(tweet_dataset['text'], "@[\w]*")

#Writing tweet dataset to csv file for future reference
tweet_dataset.to_csv('tweet_data_clean_FM.csv',index=False)
This Python code pre-processes tweet text data by removing URLs and @handles using regular expressions. The resulting cleaned text is saved to a CSV file.
Just to remind you, the retrieved tweets need data cleaning. Thus, we will remove any extra characters and Twitter handles to maintain the users’ privacy from the tweets and store them in a CSV file.
#Cleaning searched tweets and converting into Dataframe
my_list_of_dicts = []
for each_json_tweet in searched_tweets:
    my_list_of_dicts.append(each_json_tweet._json)

with open('tweet_json_FM_Data.txt', 'w') as file:
        file.write(json.dumps(my_list_of_dicts, indent=4))

my_demo_list = []
with open('tweet_json_FM_Data.txt', encoding='utf-8') as json_file:
    all_data = json.load(json_file)
    for each_dictionary in all_data:
        tweet_id = each_dictionary['id']
        text = each_dictionary['text']
        favorite_count = each_dictionary['favorite_count']
        retweet_count = each_dictionary['retweet_count']
        created_at = each_dictionary['created_at']
        my_demo_list.append({'tweet_id': str(tweet_id),
                             'text': str(text),
                             'favorite_count': int(favorite_count),
                             'retweet_count': int(retweet_count),
                             'created_at': created_at,
                            })

        tweet_dataset = pd.DataFrame(my_demo_list, columns =
                                  ['tweet_id', 'text',
                                   'favorite_count','retweet_count',
                                   'created_at'])

#Writing tweet dataset to csv file for future reference
tweet_dataset.to_csv('tweet_data_FM.csv',index=False)
The function remove_url deletes the extra characters like commas, separators, brackets, numbers, etc. It is vital to remove them so that the algorithm used for sentiment analysis can give accurate results. In addition, the function remove_pattern removes the users’ Twitter handle, which helps maintain privacy and removes any biases toward the users.
Step 4: Sentiment Analysis: Classification in Python
Since the data is clean now, we can now perform sentiment analysis using the CSV file, tweet_data_clean_FM, created above. I will show you to to categorize the tweets into two distinct categories: positive and negative.
Also, the TextBlob Python library can distinguish between these classifications.
def tweet_sentiment(txt):
    analysis = TextBlob(txt)
    if analysis.sentiment[0]>=0:
       res = 'positive'
    else:
       res= 'negative'
    return(res)
Great, now we have the predicted sentiments of the tweets. Hence, let’s choose a random sample from the dataset and compare the predicted tweets with real ones. This will check if the algorithm accurately predicts the tweets’ sentiments. Are you ready?
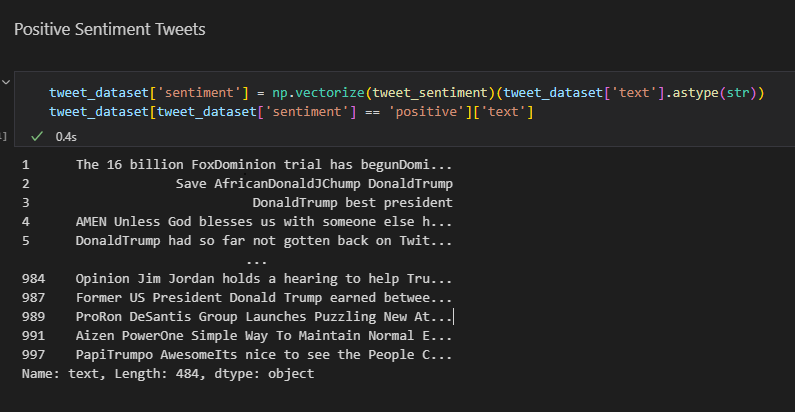
Set of Positive Sentiment Tweets
The code below reads a CSV file of tweets and applies a sentiment analysis function to each tweet to classify it as positive, negative, or neutral. Then, it filters the data frame to retrieve only the tweets classified as positive and returns the text. Cool, right?
tweet_dataset = pd.read_csv('tweet_data_clean_FM.csv')
tweet_dataset['sentiment'] = np.vectorize(tweet_sentiment)(tweet_dataset['text'].astype(str))
tweet_dataset[tweet_dataset['sentiment'] == 'positive']['text']
After you execute the code above, you will be able to view the set of positive sentiment tweets as follows:
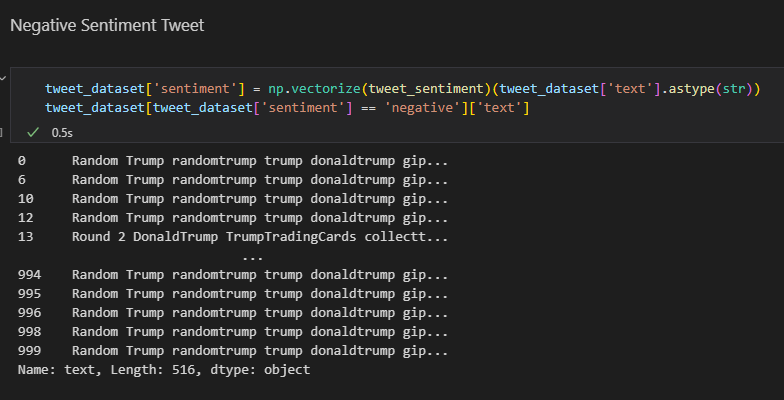
Set of Negative Sentiment Tweets
The code below reads a CSV file of tweets and applies a sentiment analysis, and filters the data frame to retrieve only the tweets classified as negative and returns the text. This is similar to how it’s done above. However, the difference is this time we want the negative tweet sroted. So, the focus is on that.
tweet_dataset['sentiment'] = np.vectorize(tweet_sentiment)(tweet_dataset['text'].astype(str))
tweet_dataset[tweet_dataset['sentiment'] == 'negative']['text']
After you execute the code lines above, you will be able to see the set of positive sentiment tweets as follows:
Here’s how the first twenty tweets will look like:
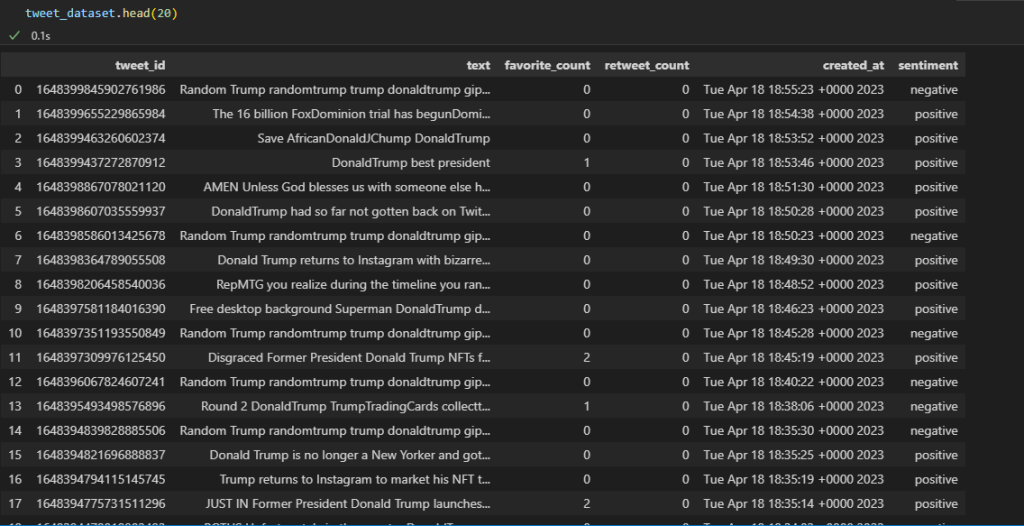
Pay close attention to the columns: text, favorite, retweet, date, and sentiment.
The analysis has performed well. However, there are still some anomalies in the prediction. For example, some positive sentiments are still shown in the tweets even though we searched for negative sentiments. Why has it happened?
Training a machine learning (ML) model with a substantial dataset can improve its accuracy in predicting outcomes, despite the complexity of human language. So, you must keep that in mind when working with ML models.
Step 5: Data Visualization in Python
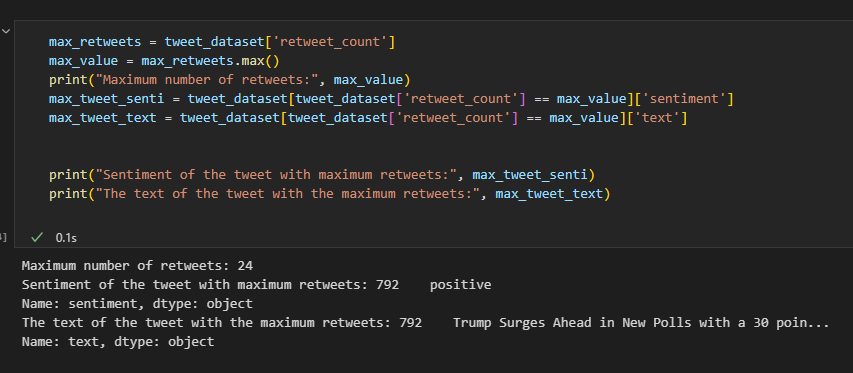
Let’s move on to display more statistics about our project. For instance, let’s display the tweet with the highest retweet along with its sentiment.
This code extracts the tweet with the highest number of retweets from a pandas data frame called “tweet_dataset”. It then prints the max number of retweets, the sentiment, and the text of the tweet with the highest retweet count to the console.
max_retweets = tweet_dataset['retweet_count']
max_value = max_retweets.max()
print("Maximum number of retweets:", max_value)
max_tweet_senti = tweet_dataset[tweet_dataset['retweet_count'] == max_value]['sentiment']
max_tweet_text = tweet_dataset[tweet_dataset['retweet_count'] == max_value]['text']


print("Sentiment of the tweet with maximum retweets:", max_tweet_senti)
print("The text of the tweet with the maximum retweets:", max_tweet_text)
Note: If there are multiple tweets with the same maximum count, it will return the sentiment and text of the first such tweet.
After running the code above, this is the output:
Lastly, we can perform various techniques to display our tweets.
This code generates a word cloud from tweets stored in a pandas data frame “tweet_dataset”. It combines all the tweet text into a string called “corpus” and removes common words using a specific set of stopwords.
Using the WordCloud library, a word cloud image is created from the “corpus” with customizable parameters such as max font size and the max number of words to include. The matplotlib library is used to display the resulting word cloud image.
The word cloud visually represents the most frequently occurring words in the tweet text.
corpus = ' '.join(tweet_dataset.astype(str).text)
# Create stopword list:
stopwords = set(STOPWORDS)
# stopwords.update(["T", "J", "D", "S", "M", "H", "et al"])

# Generate a word cloud image
wordcloud = WordCloud(stopwords=stopwords, max_font_size=50, max_words=100, background_color="white").generate(corpus)

# Display the generated image:
# the matplotlib way:
plt.imshow(wordcloud, interpolation='bilinear')
plt.axis("off")
plt.show()
Below is the word cloud from the data of the tweets analyzed:
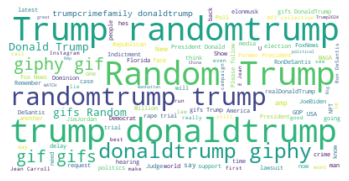
By the way, depending on the tweets you choose, it will be different. So, don’t freak out if it’s not the same for you.
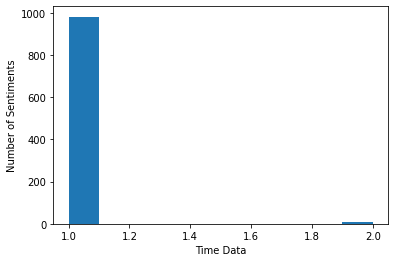
In addition, we can also make a bar graph. This will map the total number of tweet sentiments against the time difference between which these tweets were posted.
positive_counts = tweet_dataset['sentiment'].value_counts().positive
negative_counts = tweet_dataset['sentiment'].value_counts().negative
print("Total positive sentiments", positive_counts)
print("Total negative sentiments", negative_counts)


fig, ax2 = plt.subplots(1,1)
arr = np.array(list(tweet_dataset['created_at'].value_counts()))
plt.hist(arr)
ax2.set_xlabel('Time Data')
ax2.set_ylabel('Number of Sentiments')
plt.show()
This is the bar graph:
Congrats! You have completed a basic sentiment analysis using Python and its data visualization libraries. Using a simple example, you were able to plot a bar graph and a word cloud.
Conclusion: Sentiment Analysis in Python
In this post, we used Tweepy after accessing the Twitter Developer account, fetched and cleaned tweets. After that, the tweets were analyzed for sentiment. Then, we mapped the results in a word cloud and bar graph. This is the “visualization” part.
You must have seen that you can perform data analysis on any of the datasets with the help of a few Python packages. Such as numpy, scipy, pandas, matplotlib, and nltk. However, this is a quite basic example to explain an application of NLP. With it, you can also create a deep learning model using various algorithms to deal with more complex forms of data. This, in turn, will be able to perform several other data visualization techniques to improve your project.
I hope you liked this post. It should be easy to follow even for a beginner to Python. So, don’t get be scared and follow along– no matter your experience level. If you have any queries, let us know. Also, if you face errors when you run this code, reach out to us. We will make sure the erros are resolved. So, don’t worry.
Lastly, please share your experience with data visualization in Python. What cool stuff have you done, if any?
Similar posts: Nude Images: Classification of NSFW Images and Sorting Algorithms in Python: Crash Tutorial
Have a great day! Stay safe. And follow us for more relevant content.
Edited by: Syed Umar Bukhari.