Diving Deeper into Python Memory Management
You’ve now got a solid foundation in Python memory management from my previous posts on Mastering Memory Management in Python and Advanced Techniques in Python Memory Management. But the journey doesn’t stop there! Today, we delve even deeper into Python’s memory management mechanisms, examining some lesser-known but equally important techniques to manage memory efficiently. Let’s dive in!

Understanding Python’s Memory Model
Before we explore more advanced techniques, let’s recap the essential elements of Python’s memory model. Python uses a private heap space to store all objects and data structures. Memory management in this heap is ensured internally by the Python memory manager.
Memory Allocation
In Python, memory allocation for object creation is handled by the Python memory manager. Developers don’t need to explicitly allocate and deallocate memory like in languages such as C or C++. The memory manager takes care of allocating and deallocating memory addresses for your variables.
Garbage Collection
Python uses automatic garbage collection, primarily through reference counting. When an object’s reference count drops to zero, Python’s inbuilt garbage collector disposes of the object and reclaims the memory. Additionally, Python uses a cyclic garbage collector to detect and clean up reference cycles.
Memory Profiling: Identifying Memory Issues
Despite Python’s efficient memory management, applications can still suffer from memory leaks and performance bottlenecks. Here are some tools and techniques to help you identify memory issues:
Using memory_profiler
The memory_profiler module is a powerful tool to monitor the memory usage of your Python code. It provides an easy way to track the memory consumption line by line. Here’s how you can use it:
from memory_profiler import profile

@profile
def my_function():
    a = [i * 2 for i in range(10000)]
    b = [i ** 2 for i in range(10000)]
    return a, b

if __name__ == "__main__":
    my_function()
Run your script using the mprof command to get a detailed report of memory usage:
mprof run my_script.pyYou can visualize the results using:
mprof plotUsing objgraph
The objgraph module helps in understanding the object graph of your Python code. It’s particularly useful for tracking down memory leaks by showing references to objects that might be causing the issue:
import objgraph

def my_function():
    a = [i * 2 for i in range(10000)]
    b = [i ** 2 for i in range(10000)]
    objgraph.show_refs([a, b], filename='objects.png')

if __name__ == "__main__":
    my_function()
This generates a visual representation of your object’s references, allowing you to pinpoint potential leaks.
Optimizing Memory Usage
Once you’ve identified memory issues, the next step is optimization. Here are a few strategies to keep your application’s memory footprint minimal:
Using Generators
Instead of using lists, consider generators for large data sets, as they generate items on the fly and reduce memory usage:
def large_gen():
    for i in range(10000):
        yield i * 2

# Usage
gen = large_gen()
for item in gen:
    print(item)
Leveraging slots in Classes
Python’s __slots__ allows you to explicitly declare data members, preventing the creation of a dynamic dictionary and reducing memory overhead:
class MyClass(object):
    __slots__ = ['attr1', 'attr2']

    def __init__(self, attr1, attr2):
        self.attr1 = attr1
        self.attr2 = attr2
Using Built-in Functions
Utilize Python’s built-in functionality wherever possible, as they are highly optimized in C. For instance, use sum() for summing an iterable instead of looping through and adding each element.
Advanced Garbage Collection Techniques
Python provides interfaces to control and tune garbage collection. You can adjust thresholds for the garbage collector to invoke based on the growth pattern of your application’s memory allocation.
Customizing GC Behavior
The gc module gives you access to the garbage collector interface. You can programmatically manage the garbage collection process:
import gc

# Disable automatic GC
gc.disable()

# Manually trigger garbage collection
gc.collect()

# Set custom thresholds
gc.set_threshold(700, 10, 5)
The gc.set_threshold function is used to set custom thresholds for the garbage collector. These thresholds determine when the garbage collector will run its collection cycles. The function takes three arguments: threshold0, threshold1, and threshold2. Each of these thresholds corresponds to a different generation in Python’s generational garbage collection system.
Generational Garbage Collection
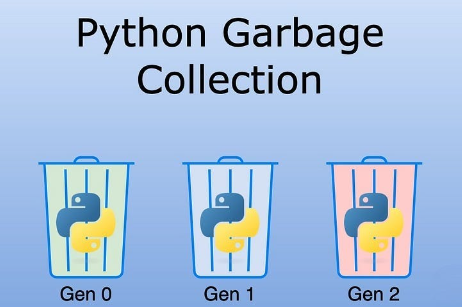
Python uses a generational approach to garbage collection, where objects are divided into three generations:
- Generation 0: The youngest generation, which contains newly allocated objects. Garbage collection is triggered frequently for this generation.
- Generation 1: Contains objects that have survived one or more garbage collection cycles in Generation 0.
- Generation 2: Contains objects that have survived multiple garbage collection cycles in Generations 0 and 1. Garbage collection is triggered less frequently for this generation.
gc.set_threshold(threshold0, threshold1, threshold2)
threshold0: The threshold for Generation 0. When the number of allocations minus the number of deallocations exceeds this threshold, a garbage collection is triggered for Generation 0.threshold1: The threshold for Generation 1. When the number of collections in Generation 0 exceeds this threshold, a garbage collection is triggered for Generation 1.threshold2: The threshold for Generation 2. When the number of collections in Generation 1 exceeds this threshold, a garbage collection is triggered for Generation 2.
In this example:
threshold0is set to 700: A collection for Generation 0 will be triggered when the number of allocations minus the number of deallocations exceeds 700.threshold1is set to 10: A collection for Generation 1 will be triggered when Generation 0 has been collected 10 times.threshold2is set to 5: A collection for Generation 2 will be triggered when Generation 1 has been collected 5 times.
Conclusion
Mastering memory management in Python is a continuous journey. By understanding and profiling your code, optimizing memory usage, and fine-tuning garbage collection, you can build efficient and robust Python applications. There’s always more to explore, so stay curious and keep experimenting!
Stay tuned for more advanced topics and practical tips in my upcoming posts. And as always, feel free to ask questions and share your experiences. Let’s keep the Python community thriving!


