Cloud vs. On-Premises GPU Costs in 2026
Key Takeaways
- Against hyperscaler on-demand pricing (AWS ~$6.88/hr for H100), on-premises clusters break even at roughly 50-83% sustained GPU use. Against specialty cloud providers charging $2.50-3.50/hr, on-premises rarely wins at any use level once staffing, power, cooling, and depreciation are fully loaded.
- Real-world GPU use averages 5% across enterprises and 40-65% for prod inference teams, far below the 80%+ threshold that vendor TCO spreadsheets assume.
- The median cloud H100 price across 327 tracked listings is $8.97/hr, but the 25th-percentile price, what a careful buyer actually pays, is $3.50/hr, according to GPU Tracker data from April 2026.
- Staffing is often the largest TCO line item for on-premises deployments, exceeding hardware costs over a 3-year horizon. Budget at least 0.5-1 FTE per cluster.
- The break-even answer depends entirely on which cloud price you compare against. There is no single “buy if you use it X% of time” rule in 2026.
The Pricing Tail Problem
Gartner estimates that AI infrastructure will absorb roughly $401 billion in new spending in 2026. Reserved accelerator fleets sit idle. Purchased clusters run at a fraction of their rated capacity. The industry is pouring capital into hardware that, by every measurable standard, it is not using.

The use Reality: Why 5% Is the Number That Matters
The single most important variable in any GPU infrastructure decision is use, the percentage of time a GPU is doing productive work rather than drawing idle power. Every TCO model, every break-even chart, and every boardroom spreadsheet hinges on this number. And the number most organizations should use is not the one they want.
It reflects the reality of serving user-facing apps where traffic follows diurnal patterns, weekends dip, and request batching hits diminishing returns at certain concurrency levels.
At the enterprise level, the numbers are worse. The VentureBeat report cites real-world audits showing average GPU use stuck at 5%. Reserved capacity sits idle. Provisioned clusters run experiments once a week, then cool. The gap between procurement optimism and operational reality is measured in billions of dollars of stranded compute.
This use gap is structural. Training workloads are bursty by nature: a team spins up a cluster for a two-week fine-tuning run, then the GPUs sit idle while results are analyzed. Inference workloads are continuous but variable: request volume follows user behavior, not a flat line. The 24/7 flat-line use that makes on-premises CapEx math work is a spreadsheet abstraction, not operational reality for most teams.
Cloud GPU Pricing Tiers: The 99% Hyperscaler Premium
Cloud GPU pricing in 2026 is at least three separate markets, separated by a structural premium that has persisted across every 24-hour pricing snapshot tracked since February 2026.
At the top sits the hyperscaler tier. AWS lists H100 SXM5 instances at roughly $6.88 per GPU-hour on-demand. Azure charges approximately $12.29 per GPU-hour on its ND H100 v5 instances. Google Cloud’s A3 instances run around $10.98 per GPU-hour. These are the prices most enterprise procurement teams anchor on, because these are the clouds their organizations already use, already have compliance attestations for, and already have networking and identity integrated with.
At the middle sits the specialty cloud tier. CoreWeave lists H100 at roughly $4.76-$6.16 per GPU-hour. Lambda Labs ranges from $2.49 to $3.44. Nebius charges $3.85. These providers offer the same physical silicon, an H100 SXM5 is an H100 SXM5, without the bundled enterprise services, compliance frameworks, and global region coverage that hyperscalers wrap around their GPU instances.
At the bottom sits the marketplace and decentralized tier. Spheron listed H100 SXM5 on-demand at $2.54 per GPU-hour as of July 2026, with spot pricing at $2.91 (spot briefly cost more than on-demand due to tight pool dynamics). RunPod’s marketplace aggregates third-party hosts at competitive rates. Vast.ai’s peer-to-peer model lists H100s at $1.53-$2.27 per hour. io.net, with a claimed network of 320,000+ GPUs across 130+ countries, prices H100s at $2.10-$3.50 per hour.
The scale of the pricing spread is captured in GPU Tracker’s April 2026 dataset. Across 327 tracked H100 listings, the same physical chip rents for anywhere from $0.80 per hour on spot to $97.44 per hour on hyperscaler reserved multi-GPU bundles, a 122x spread. Hyperscaler H100 prices are 99% higher than specialty cloud providers for the same chip. The median H100 price across all tracked listings is $8.97 per hour, but the 25th-percentile price, the number a careful buyer can realistically obtain, is $3.50 per hour.
| Cloud Tier | H100 SXM5 On-Demand ($/GPU-hr) | Spot/Preemptible ($/GPU-hr) | Egress Fee | Typical Commitment |
|---|---|---|---|---|
| Spheron | $2.54 | $2.91 (Jul 2026) | None | None (on-demand) |
Sources: Spheron GPU Cloud Pricing Comparison (July 2026), GPU Tracker Cloud Statistics (April 2026). Pricing fluctuates daily. Check provider pages for current rates.
If your comparison point is Spheron at $2.54 per hour, on-premises may never break even once staffing, power, cooling, and depreciation are fully loaded.
On-Premises TCO: What an Owned Cluster Actually Costs
The purchase price of a GPU is the beginning of the cost story, not the end. A prod-grade 8-GPU H100 SXM5 node requires a server chassis, NVLink interconnect, InfiniBand networking, high-speed NVMe storage, and facility infrastructure: power, cooling, rack space, and physical security. The all-in CapEx for a 100-GPU row, based on editorial midpoints from OEM server pricing and Lenovo ThinkSystem reference cfgs in Q2 2026, lands around $7.65 million, or roughly $76,500 per GPU installed.
That CapEx figure includes compute hardware ($3.84M for 13 nodes at approximately $295K each), facility fit-out ($2.1M for 160 kW IT load at PUE 1.35), networking fabric ($1.4M for InfiniBand leaf-spine with optics), and spares and installation ($0.31M). Against hyperscaler on-demand at $3.25 per GPU-hour, the same 100 GPUs would cost roughly $234,000 per month in cloud rent, or $2.81 million per year with zero residual asset.
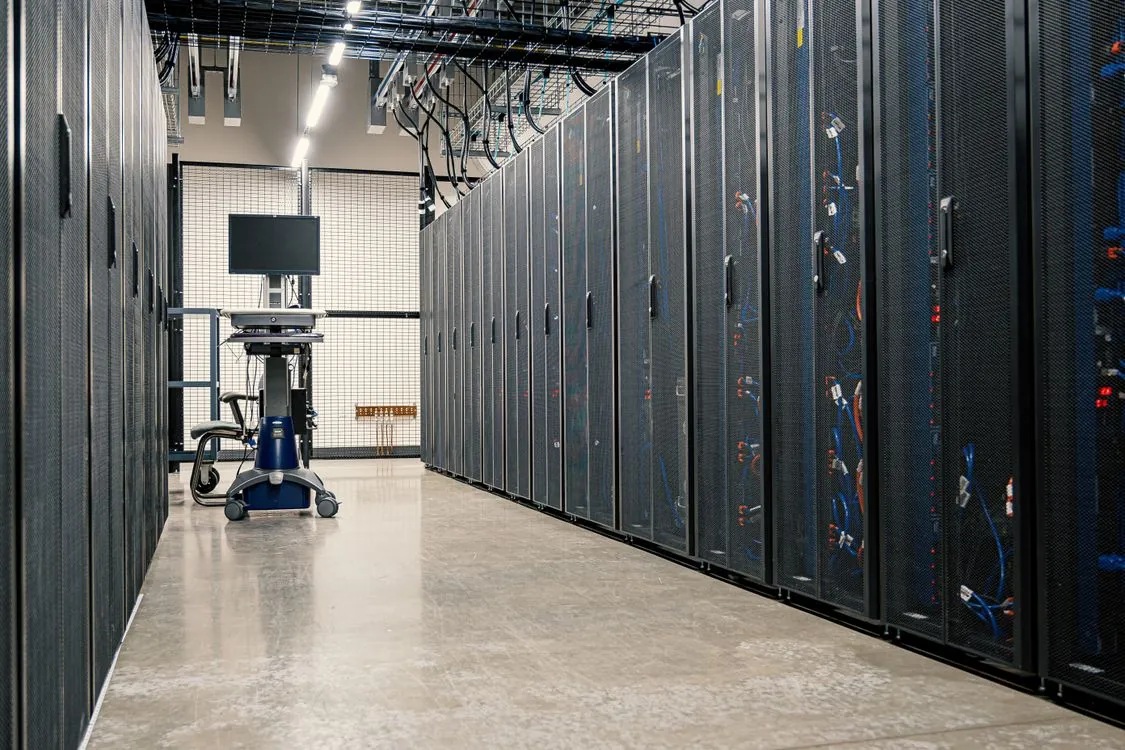
But CapEx is only half the equation. Once hardware lands, operating expenses determine whether owned clusters stay cheaper than cloud. Power dominates the OpEx stack. An 8-GPU H100 node draws roughly 5.6 kW of IT load. At $0.10 per kWh wholesale and PUE of 1.40, energy alone costs $470-$520 per GPU per month. Demand charges in constrained grids can add 20-40% on top of that. Staffing is often the single largest TCO line item: 0.5 FTE infrastructure engineer at fully loaded cost runs $75,000-$100,000 per year, or $225,000-$300,000 over three years, according to the Spheron TCO breakdown. That exceeds amortized hardware cost in many cfgs.
Then there is depreciation. GPU hardware follows a distinctive depreciation curve driven by architecture cycles rather than simple age. An H100 purchased for $30,000 today may be worth $9,000-$10,500 in two years, and B200 and Rubin architectures arriving in 2026-2027 will compress that timeline further.
The io.net 3-year TCO analysis puts the full picture in perspective. For a single 8-GPU H100 SXM node, 3-year total ranges from $481,300 to $1,046,300, yielding an effective hourly rate of $2.29 to $4.97 per GPU-hour, assuming 100% use. At the low end of that range, with cheap power, existing rack space, and amortized staffing across a large fleet, on-premises can compete with specialty cloud pricing. At the high end, it cannot.
Break-Even Math: Where the Lines Cross
The break-even formula is straightforward: divide upfront all-in CapEx by the difference between monthly cloud cost and monthly on-premises OpEx. The result, in months, tells you how long before ownership becomes cheaper than rental. What makes the answer slippery in 2026 is that both numerator and denominator depend on assumptions that vary dramatically across organizations.
The GPU Insights analysis, using a 100-GPU H100 row at $7.65 million all-in CapEx and $55,000 per month OpEx, shows the sensitivity clearly. Against hyperscaler on-demand at $3.25 per GPU-hour, break-even lands at 3.6 months at 85% use and 5.1 months at 60% use. Against 1-year reserved pricing at $2.35 per hour, those numbers stretch to 5.5 months and 7.8 months respectively. Against 3-year reserved at $1.85 per hour, break-even reaches 8.7 months even at 85% use. Against spot pricing at $1.65 per hour, break-even pushes past 10 months.
Lenovo’s 2026 TCO whitepaper, updated in July 2026, reports that on-premises infrastructure achieves breakeven in under four months for high-use workloads against on-demand cloud pricing in modeled ThinkSystem cfgs. The same analysis finds that owning infrastructure yields up to 17 times cost advantage per million tokens compared to Model-as-a-Service APIs over a five-year lifecycle. Those figures assume enterprise duty cycles, not demo clusters, and include power at modeled U.S. colocation rates.
But the Lenovo figures compare against hyperscaler on-demand and MaaS API pricing. They do not compare against specialty cloud providers where H100s rent for $2.50-$3.50 per hour. The Spheron analysis, using its own on-demand pricing of $2.90 per GPU-hour, finds that cloud costs less than on-premises even at 100% use once full TCO is loaded. The io.net analysis reaches the same conclusion: at its midpoint pricing of $2.50 per hour, on-premises never breaks even against fully loaded TCO that includes staffing, infrastructure, and depreciation.
The resolution of this apparent contradiction lies in which cloud price you compare against. There is no single break-even number in 2026. There is a break-even surface, defined by three variables: your cloud price anchor, your actual sustained use, and your all-in on-premises cost per GPU-hour.
| Cloud Price Anchor ($/GPU-hr) | Break-Even at 60% Util | Break-Even at 75% Util | Break-Even at 85% Util |
|---|---|---|---|
| $6.88 (AWS on-demand) | ~4.5 months | ~3.5 months | ~3.0 months |
| $3.25 (hyperscaler blended) | 5.1 months | 4.1 months | 3.6 months |
| $2.90 (Spheron on-demand) | ~8 months | ~6 months | ~5 months |
| $1.85 (3-yr reserved) | Never | 12.4 months | 8.7 months |
Sources: GPU Insights editorial estimates (June 2026), Spheron break-even analysis (April 2026), io.net decision guide (2026). Assumes 100-GPU H100 row at ~$7.65M CapEx, ~$55K/month OpEx. “Never” means on-premises costs more than cloud even at 100% use.
The table makes visible what most boardroom conversations miss: the break-even answer flips entirely depending on which cloud price you anchor on. An organization that compares against AWS on-demand pricing will see a compelling on-premises business case at any use above 50%. An organization that compares against specialty cloud pricing will struggle to justify on-premises at any use level. Both are correct. They are just using different denominators.
The Hidden Costs Nobody Models
Several cost categories rarely appear in vendor TCO spreadsheets but materially affect the real economics of both deployment models.
Data egress. AWS and Azure charge $0.087-$0.09 per GB for outbound data. Google Cloud charges $0.11-$0.12 per GB. At 1 TB per day of inference output (text, embeddings, completions), that is roughly $2,600-$3,600 per month in egress alone, before any compute cost. Many specialty cloud providers, including Spheron and CoreWeave, do not charge egress fees. Over a 3-year horizon, the egress delta between a hyperscaler and a no-egress provider can exceed $100,000 for a single high-volume inference deployment.
Meta’s 16,384-GPU H100 deployment showed approximately 9% annualized failure rates. A failed H100 SXM5 mid-contract costs $25,000-$35,000 to replace and typically takes weeks due to lead times. When an on-premises GPU fails, inference capacity drops immediately. Cloud failures result in instance replacement, usually resolved in minutes. The operational burden of hardware failure, diagnosis, RMA processing, spare inventory, and downtime, is a real cost that on-premises buyers absorb and cloud buyers offload to the provider.
On-premises, you pay for this regardless of whether the GPU is serving requests. In the cloud, idle GPUs are not running, so you pay nothing. At $0.12 per kWh, a single idle H100 costs roughly $105 per year. That is modest at one-GPU scale, but $10,500 per year for a 100-GPU cluster. Over three years, idle power alone can add $30,000+ to an on-premises bill, even before productive work begins.
Redundancy overhead. On-premises deployments require N+1 or N+2 power and cooling redundancy. Cloud providers handle redundancy transparently and amortize it across their customer base.
When Regulation Decides Before the Spreadsheet Opens
For a significant subset of organizations, the cloud-versus-on-premises decision is made before anyone opens a cost model. Data sovereignty and regulatory compliance are hard constraints, not economic variables.
The EU AI Act’s general-purpose-AI obligations, enforceable since August 2025, carry fines up to 7% of global turnover for the most serious violations. Under GDPR Article 46, EU financial institutions cannot freely route customer data through US-hosted LLM APIs without specific safeguards. The EU’s Cloud and AI dev Act, adopted in June 2026, adds another layer of sovereignty-focused requirements for cloud and AI services. For regulated finance, healthcare, government, and defense organizations, deployment location is a legal question before it is a cost question.
The iternal.ai on-premises deployment guide reports that by 2025, roughly 71% of AI infrastructure ran outside public cloud, driven heavily by financial-services data-residency requirements and the arrival of enforceable AI regulation. That figure reflects not a rejection of cloud economics but a recognition that for regulated workloads, the cloud may not be an option at all.
Oracle, in a July 2026 blog post on sovereign AI, described the shift: “Sovereign customers are growing as regulatory expectations expand beyond basic data residency into full-stack control, where data, infrastructure, and operational governance stay aligned within defined jurisdiction.” The trend is toward deployment architectures where the legal boundary determines the infrastructure boundary, and the cost conversation follows rather than leads.
A Decision Framework for 2026
Given the fractured pricing landscape, the use reality, and regulatory pressures, a useful decision framework for 2026 needs to start with constraints and work toward economics, not the reverse.
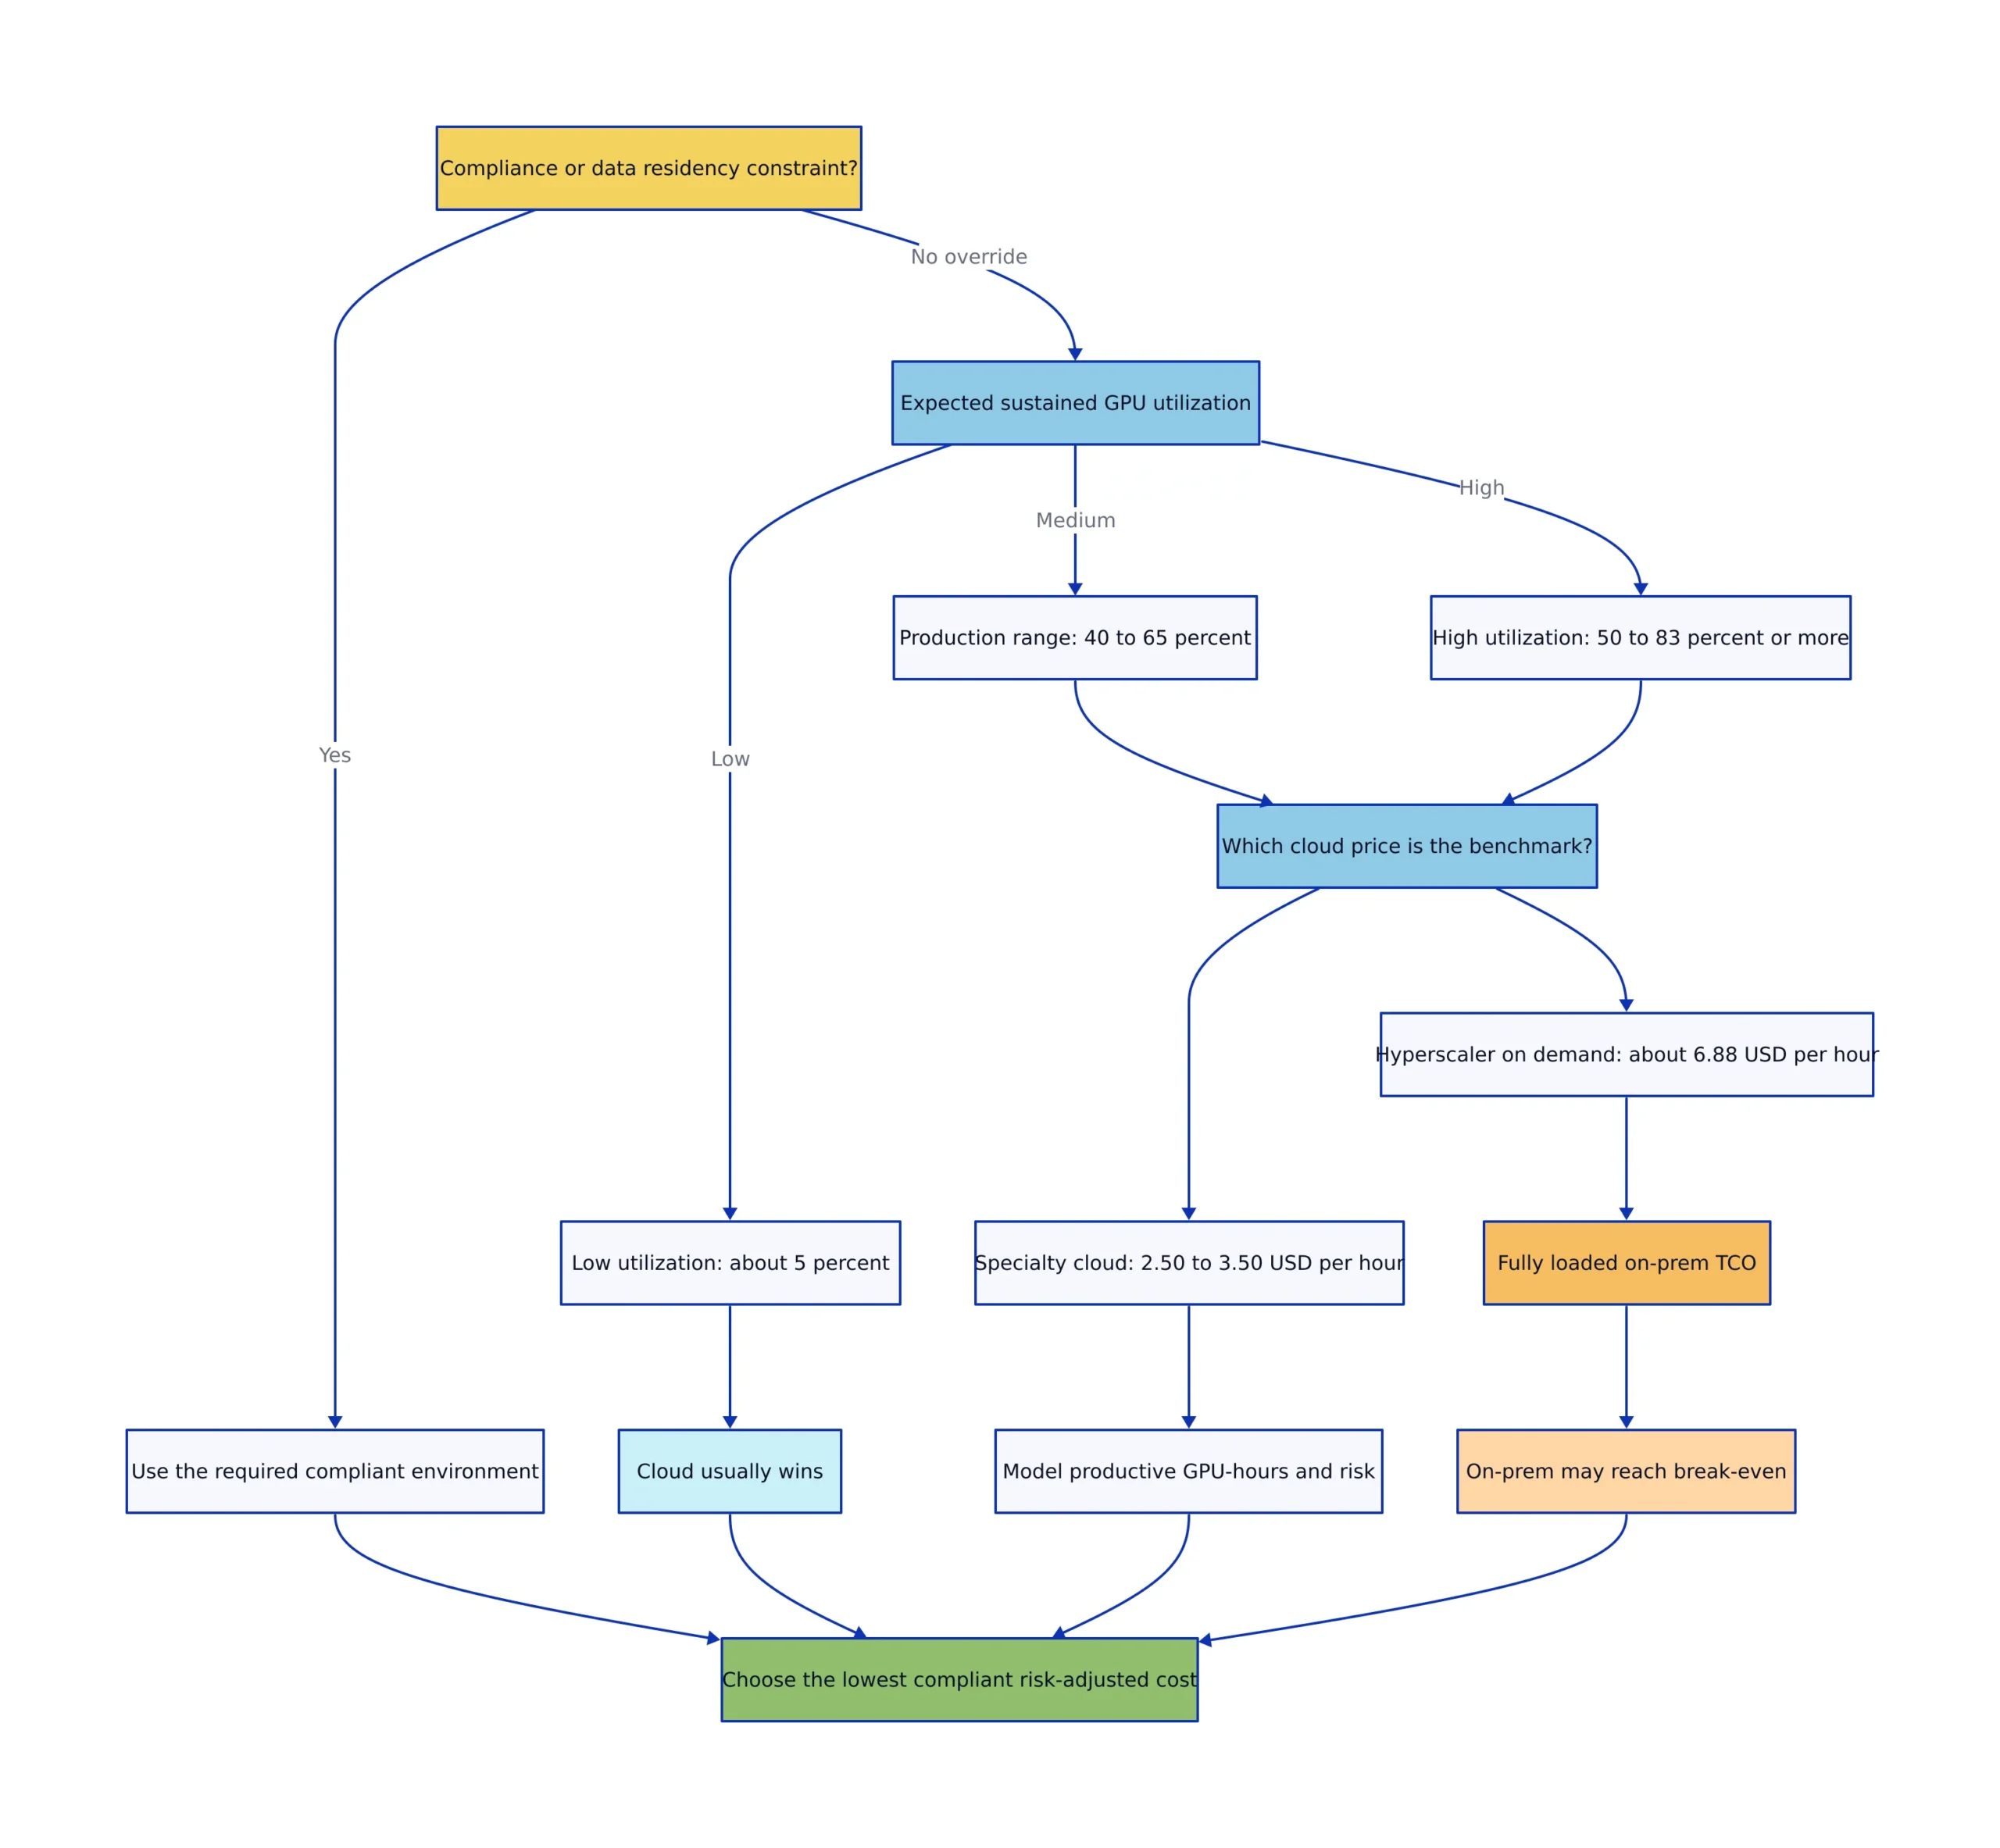
First, answer the hard-constraint question. Does regulation, data residency, or security policy require your model weights or inference data to stay within a specific jurisdiction or on physically controlled infrastructure? If yes, the decision is made. On-premises or private cloud is the path. Move to sizing and procurement.
Second, measure your actual use. Run nvidia-smi dmon or check your cloud monitoring. If average GPU use is under 70%, you almost certainly do not have the workload profile to justify on-premises, unless regulation forces your hand. Low use means you are paying for idle capacity, and idle capacity is the fastest way to destroy an on-premises business case.
Third, identify your cloud price anchor. Are you comparing against hyperscaler on-demand, hyperscaler reserved, specialty cloud, or marketplace pricing? The answer changes the break-even calculation by a factor of 2-3x. Be honest about which tier your organization would actually use. The compliance, networking, and support requirements that push you toward hyperscalers also push up your cloud cost denominator, which makes on-premises more attractive.
Fourth, model full TCO. Include hardware, facility, power, cooling, networking, storage, staffing, maintenance, spares, depreciation, and redundancy overhead. The Spheron TCO model shows that staffing alone can exceed hardware costs over three years. The GPU Insights CapEx model shows that facility and network fabric add 25-40% on top of server invoices at 500+ GPU scale. If your model only counts the GPU purchase price, it is wrong.
Fifth, consider a hybrid path. For teams that already own on-premises GPU infrastructure, the choice is not binary. Keep baseline inference capacity on-premises, sized for median traffic. Burst to cloud for peak load, experimentation, and non-prod workloads. Target on-premises use of 80%+ on baseline load, where the math works, while avoiding the capital requirement to size for peak demand. The cloud burst component is often spot-eligible, bringing cost down further.
The GPU infrastructure decision in 2026 is a portfolio problem: which workloads go where, at what use, against which pricing tier, under which regulatory constraints. The organizations that get this right are the ones that measure use honestly, model TCO completely, and match each workload to the infrastructure tier where its economics actually work.
As we explored in our earlier AI infrastructure cost comparison, the most effective organizations dynamically tune their infrastructure mix as workload patterns and product maturity evolve. The same principle applies with sharper edges in 2026: the pricing landscape has fragmented, use remains the hardest number to improve, and the break-even answer depends on which cloud price you put in the denominator.
Sources and References
Sources cited while researching and writing this article:
Priya Sharma
Thinks deeply about AI ethics, which some might call ironic. Has benchmarked every model, read every white-paper, and formed opinions about all of them in the time it took you to read this sentence. Passionate about responsible AI, and quietly aware that "responsible" is doing a lot of heavy lifting.