
Performance Tuning SQLite for High-Throughput Applications
Switch a SQLite database from rollback journal mode to WAL, pair it with synchronous=NORMAL, and a single experiment that logged roughly 279 inserts per second jumps to about 33,135 inserts per second on the same drive. That 100x swing is documented by Travis Horn in a hands-on production benchmark from early 2026, and it is the cleanest possible proof that SQLite’s factory configuration is a performance ceiling, not a hard limit. The engine is fast; the default PRAGMA settings are what hold it back. In Part 3 of this series we compared SQLite and PostgreSQL and established that SQLite is a single-writer engine that wins on read-heavy single-server loads. This part turns that conclusion into a tuning playbook: which journal mode to pick, how large the cache should be, how to structure transactions, and how to measure whether each change helped.
The Throughput Benchmark That Shifts the Argument
The numbers are worth internalizing before any tuning, because they tell you where the wins actually live. Horn ran 10,000 individual INSERT statements, each in its own autocommitted transaction, and measured inserts per second across journal mode and synchronous combinations, per the benchmark writeup.

| Journal mode | Synchronous | Inserts per second | Observations |
|---|---|---|---|
| DELETE | FULL | ~279 | Forces a disk flush on every commit; highest CPU overhead |
| DELETE | NORMAL | ~243 | Still high disk I/O; no real gain |
| DELETE | OFF | ~1,139 | Faster but risks corruption on crash |
| WAL | FULL | ~442 | Better than DELETE, but the full sync kills WAL benefits |
| WAL | NORMAL | ~33,135 | The sweet spot; over 100x the default |
| WAL | OFF | ~61,994 | Fastest, but data loss risk on power failure |
Two conclusions follow. First, journal mode alone is not enough: WAL with synchronous=FULL only reaches about 442 inserts per second, barely better than the baseline, because every commit still forces a physical flush. Second, the durability trade is contained: synchronous=NORMAL in WAL mode keeps the database consistent after a crash while losing only the most recent uncommitted transactions. The default DELETE-plus-FULL combination is both the slowest and the most wasteful, because it serializes every write through a temporary journal file and then replaces the main database on top of forcing fsync. If you remember one benchmark from this article, remember that row.
Journal Modes: WAL Is the Production Default, Not DELETE

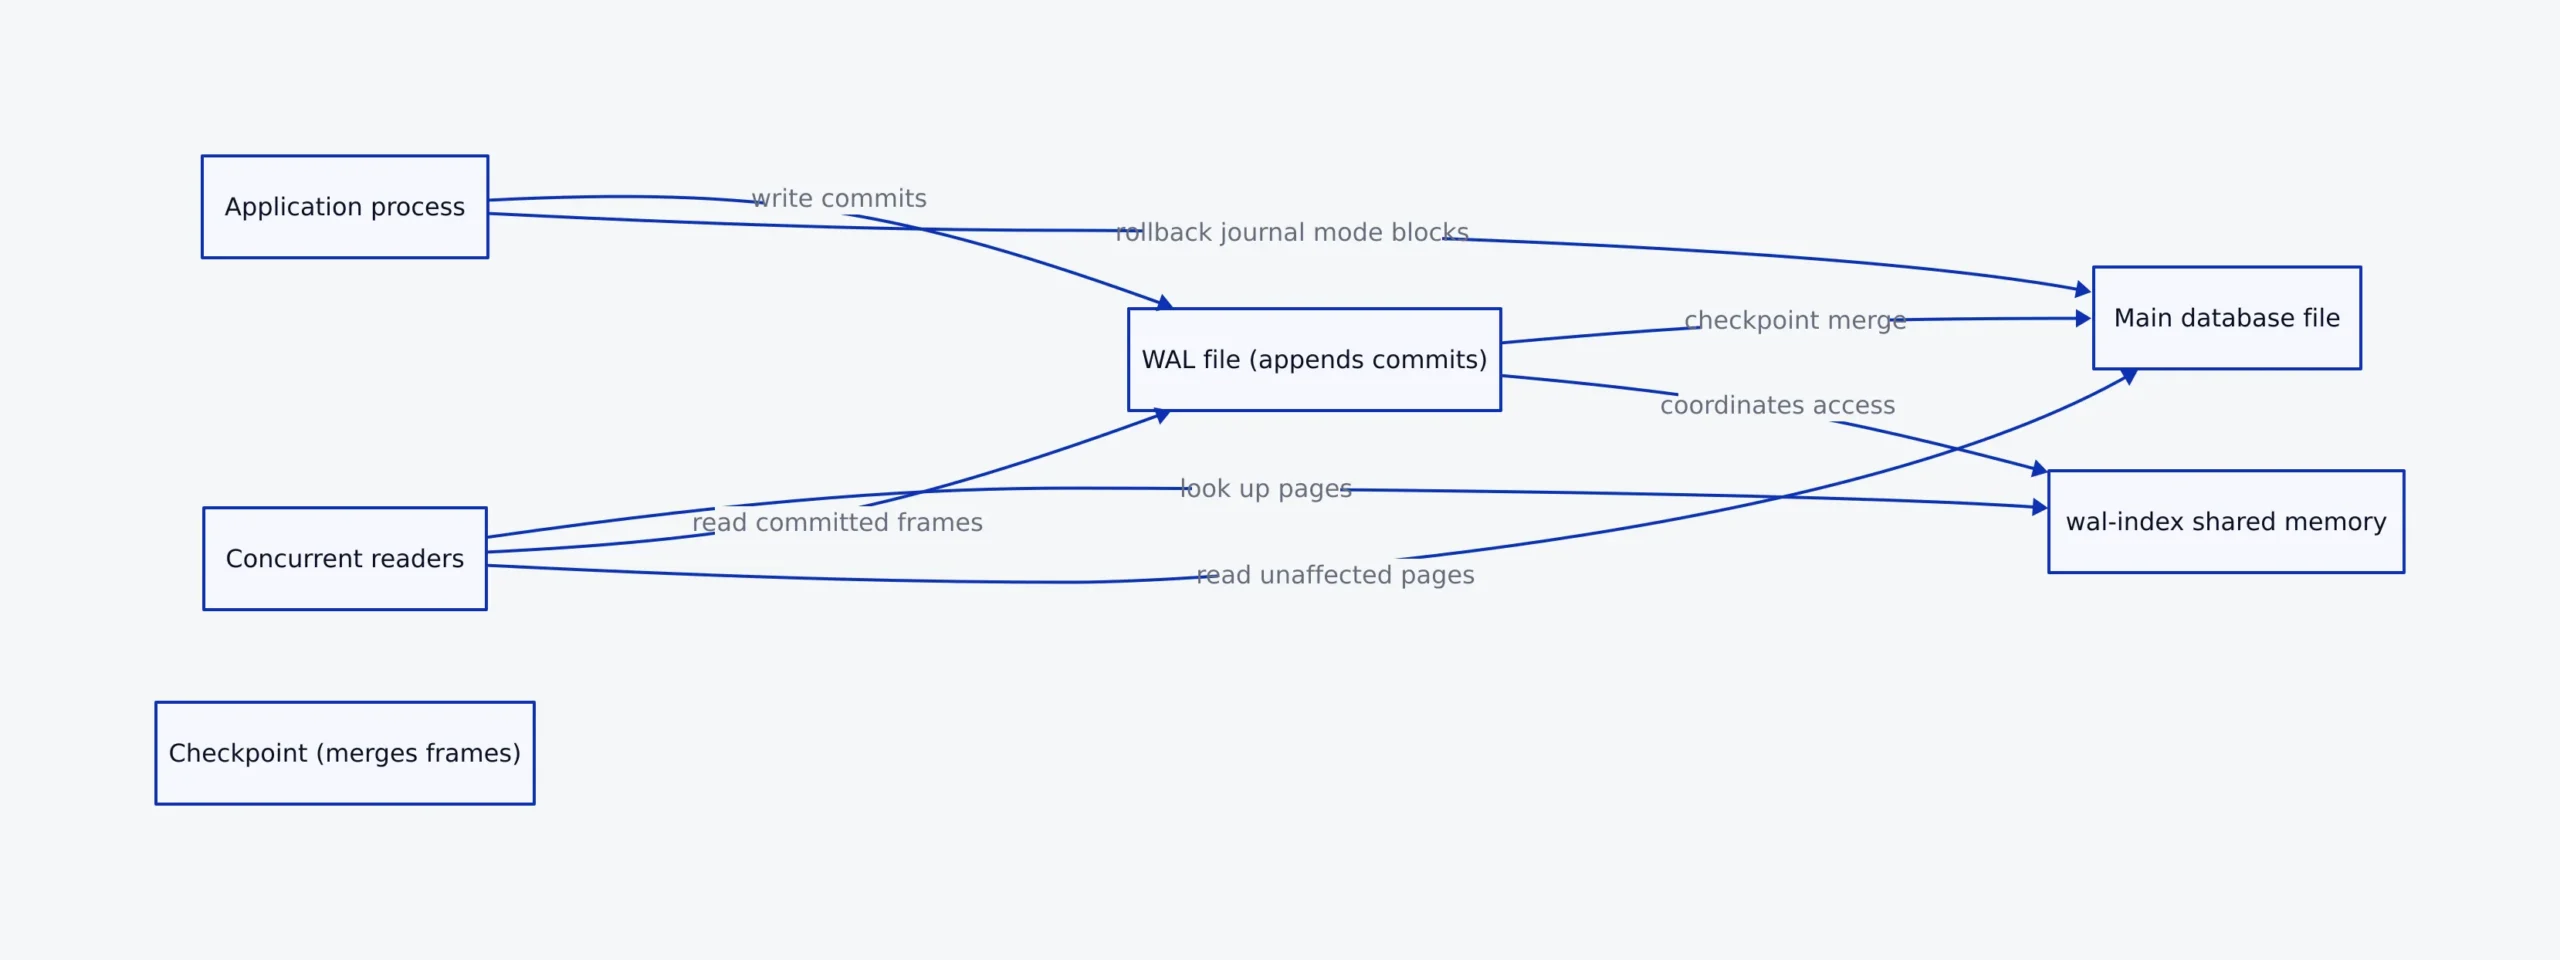
The official SQLite WAL documentation lists why Write-Ahead Logging beats the rollback journal for most scenarios: it is significantly faster, it provides more concurrency because readers do not block writers and the writer does not block readers, disk I/O tends to be more sequential, and it uses far fewer fsync() calls. In WAL mode, writers append committed transactions to a separate .db-wal file while readers keep reading a consistent snapshot from the main file plus the WAL. The commit happens when a record is appended to the WAL, so the main database file is never half-written.
The costs are real and worth stating plainly. All processes using a WAL database must share a small amount of memory through the -shm wal-index, so all processes must run on the same host machine. WAL does not work over a network filesystem. WAL can be 1 to 2 percent slower than rollback journal in applications that mostly read and rarely write. And there is an extra operation, checkpointing, that the developer must manage. The 2026 ADHDecode analysis of concurrent writes adds two more caveats: the WAL file grows with writes, so on an extremely write-heavy instance with infrequent checkpoints it can temporarily consume more disk than a DELETE journal, and backup strategies that rely on atomically renaming a single file must instead copy all three files (the main file, the -wal, and the -shm) together.
For a typical high-throughput cloud service with sustained mixed read and write traffic, WAL is the right choice. The edge cases where DELETE or another rollback mode wins are narrow: single-writer, read-mostly workloads where the overhead of the WAL and its checkpointing is not worth it, or transactions larger than about 100 megabytes, where the SQLite documentation notes rollback journal modes will likely be faster. Those are decided per-deployment, not per-recipe.
The Production PRAGMA Stack Applied on Every Connection
Here is the configuration that production hardening guides converge on. The SQLite Hardening WAL optimization reference calls this the canonical hardened stack for WAL operation, and it matches the recommended defaults in the hands-on benchmark and the PRAGMA preview that closed Part 3 of this series. Apply it immediately after opening every connection, and verify it by reading each value back, because connection pooling layers and ORMs commonly reset connection state behind your back.
-- The canonical production stack for a WAL database
PRAGMA journal_mode = WAL; -- concurrent readers + one writer
PRAGMA synchronous = NORMAL; -- fsync at checkpoint, not every commit
PRAGMA wal_autocheckpoint = 1000; -- checkpoint every ~4 MB (1000 pages)
PRAGMA cache_size = -64000; -- 64 MB page cache (negative = KiB)
PRAGMA busy_timeout = 5000; -- retry a locked write for 5 seconds
PRAGMA temp_store = MEMORY; -- keep temp b-trees out of disk
PRAGMA mmap_size = 1073741824; -- map up to 1 GB for memory-mapped reads
PRAGMA foreign_keys = ON; -- off by default; set on every connection
-- Note: production use should also verify each pragma by reading it back
-- after opening the connection, since poolers may not re-apply them.
Two settings carry the most load. wal_autocheckpoint governs how many pages accumulate before SQLite triggers a passive checkpoint; set it too high and the WAL bloats during write bursts, too low and you thrash flash endurance. mmap_size maps database pages directly into the process address space, which the Micrologics production tuning guide notes turns disk reads into near pointer arithmetic when the database fits under the mapping limit; its blueprint uses PRAGMA mmap_size = 1073741824 for a 1 GB mapping. The Hardening reference advises setting mmap_size to zero on 32-bit targets and devices with unstable power, since it is a liability there.
The verify-after-apply discipline is not optional. In Python, the sqlite3 module starts every fresh connection from the library’s conservative defaults, and pooling libraries frequently hand back a recycled connection whose PRAGMA state has drifted. A deterministic setup routine that applies the stack and then asserts each value prevents a silent drop from WAL to DELETE or from NORMAL to FULL under load.
import sqlite3

PRAGMAS = {
 "journal_mode": "wal",
 "synchronous": 1, # 1 == NORMAL
 "wal_autocheckpoint": 1000,
 "cache_size": -64000, # 64 MB page cache
 "busy_timeout": 5000,
 "foreign_keys": 1,
 "temp_store": 2, # 2 == MEMORY
}

def open_hardened(path: str) -> sqlite3.Connection:
 conn = sqlite3.connect(path, timeout=5.0, isolation_level=None)
 try:
 conn.execute("PRAGMA journal_mode = WAL")
 conn.execute("PRAGMA synchronous = NORMAL")
 conn.execute("PRAGMA wal_autocheckpoint = 1000")
 conn.execute("PRAGMA cache_size = -64000")
 conn.execute("PRAGMA busy_timeout = 5000")
 conn.execute("PRAGMA foreign_keys = ON")
 conn.execute("PRAGMA temp_store = MEMORY")
 # Verify after apply, never trust that the settings stuck.
 for pragma, expected in PRAGMAS.items():
 got = conn.execute(f"PRAGMA {pragma}").fetchone()[0]
 if str(got).lower() != str(expected).lower():
 raise RuntimeError(
 f"PRAGMA {pragma} = {got!r}, expected {expected!r}"
 )
 return conn
 except Exception:
 conn.close()
 raise
The isolation_level=None flag disables the sqlite3 module’s implicit transaction management so that BEGIN IMMEDIATE and COMMIT become explicit and observable. That matters because it turns mid-transaction SQLITE_BUSY failures into immediate, clean rollbacks your retry queue can handle, rather than errors surfacing after you have already done read work that is now wasted.
Cache Size: Turning Disk I/O Into Memory Reads
SQLite’s default cache is small, typically around 2 MB. The Micrologics guide recommends scaling it to keep your working set in memory. The cache_size pragma accepts a positive value as a page count or a negative value as kibibytes. The practical rule from the Hardening reference and multiple production guides is a 64 MB cache (-64000) as a starting point, then tune against your database size and available RAM.
The mechanism is straightforward. A page is the smallest unit of disk I/O, typically 4 KB. Each time a query needs a page that is not already in SQLite’s user-space page cache, it performs a read from the OS. The 2026 ADHDecode PRAGMA tuning guide explains that a negative cache_size tells SQLite to try to keep up to total_pages - abs(cache_size) pages in memory, which effectively caches as much as fits. For a database that mostly fits in RAM, this is the difference between microsecond reads from the buffer and millisecond reads that touch disk.
There is no universal best number, only a measurement. The Hardening cache_size tuning page for embedded Linux is candid that the right value is workload-specific and memory-constrained targets need a fraction of the desktop default. The pattern to follow in a cloud service: if a working set of a few hundred megabytes is in RAM, set the cache so a large fraction of your hot pages live in memory, then test. Increasing the cache reduces the number of system calls and disk reads for repeated queries, but it consumes RAM, so a multi-tenant shared instance must be careful not to starve the rest of the process.
The same principle extends to temp_store=MEMORY, which the ADHDecode guide recommends for complex sorts and joins that would otherwise spill temporary tables to disk. That too is a trade: putting temp b-trees in RAM is faster but risks memory exhaustion if a single operation is large enough to spill. The Hardening reference frames this as a discipline: keep temp data out of constrained storage and out of unencrypted storage, and set temp_store to memory only when the server has headroom.
Transaction Management: Batching, Prepared Statements, and Lock Discipline
Journal mode and cache size get the headline numbers, but transaction handling is where most of the remaining latency lives. The ADHDecode batch insert analysis makes the core point: each INSERT executed in its own autocommitted transaction makes SQLite acquire a lock, write, and release the lock for every single row. Wrapping all inserts in one explicit BEGIN and COMMIT reduces disk I/O and contention dramatically because the lock and the journal are handled once for the whole batch. A bulk load that runs as a loop of single-row commits can be tens of thousands of times slower than the same rows inside one transaction.
Prepared statements multiply the gain. Recompiling the same SQL string for every insert is wasted work, so prepare the statement once and reuse it. In Python the practical tool is executemany, which binds parameters for many rows against a single compiled statement inside your transaction. Combine three techniques and a load path that originally crawled can reach tens of thousands of rows per second. The Hardening reference adds the discipline: wrap every writer in BEGIN IMMEDIATE so the write lock is acquired at the start of the transaction, converting a mid-transaction SQLITE_BUSY into an immediate, cleanly rolled-back failure that the retry queue can handle.
import sqlite3

def bulk_insert(conn, rows):
 # One transaction, one prepared statement, repeated binds.
 conn.execute("BEGIN IMMEDIATE") # take the write lock up front
 try:
 conn.executemany(
 "INSERT INTO events (device_id, ts, payload) VALUES (?, ?, ?)",
 rows,
 )
 conn.execute("COMMIT")
 except sqlite3.OperationalError as exc:
 conn.execute("ROLLBACK")
 if "database is locked" in str(exc):
 # Escalate to an app-level retry queue with backoff.
 raise TimeoutError("write lock unavailable after busy_timeout") from exc
 raise

# rows = [(device_id, timestamp, payload), ...]
# Note: production use adds a row cap per transaction so a huge batch
# does not hold the write lock for an unbounded time.
Lock discipline is the counterpart to batching. The SQLite locking primer explains the five lock states and stresses that keeping transactions short is your primary defense. A write transaction that is opened with BEGIN and not promptly committed holds a RESERVED or EXCLUSIVE lock, blocking other writers and sometimes new readers. Use context managers, commit as soon as the writes are done, and never leave a transaction open across a network call or a long computation. The default busy timeout is zero, meaning a second writer fails with SQLITE_BUSY immediately; the busy_timeout of 5,000 ms in the production stack makes SQLite retry the lock internally with exponential backoff before raising the error.
Checkpointing: The Third Operation Nobody Plans For
Rollback journal mode has two primitive operations, reading and writing. WAL mode adds a third: checkpointing, where the content of the WAL file is merged back into the main database. The SQLite WAL documentation is explicit that this is something developers must manage, not ignore. By default SQLite auto-checkpoints when the WAL reaches about 1000 pages, but the default threshold and the passive checkpoint style can cause latency spikes and WAL bloat in high-write cloud services.
The Micrologics guide names the failure mode precisely: checkpoint starvation. A checkpoint can only reclaim WAL frames older than the oldest reader snapshot. If a long-running reader holds a snapshot open while writers keep appending, the WAL cannot be truncated and grows without bound, eventually exhausting the partition and raising SQLITE_FULL. There are four checkpoint modes: PASSIVE merges as much as it can without blocking anyone; FULL blocks new writes and waits for readers; RESTART also resets the WAL size; TRUNCATE truncates the WAL to zero on disk. For a high-write server you should manage checkpointing explicitly in a background thread or separate process with PASSIVE or RESTART scheduled during idle windows, rather than relying on the default heuristic.
There is an inherent trade between read and write performance. Read performance deteriorates as the WAL grows, because each reader must check the WAL and the wal-index for the latest version of a page. Write performance improves when checkpoints run infrequently so the cost of each checkpoint is amortized over more commits. The default of checkpointing once the WAL hits 1000 pages works well on workstation tests, but a cloud service with a sustained write burst wants an explicit policy. When you disable automatic checkpointing and run checkpoints from a separate thread, set synchronous=NORMAL so the main query thread never blocks on a sync operation.
Hardware: Why SSDs and fsync Behavior Dominate Throughput
Hardware is not a PRAGMA, but it decides how much the PRAGMAs can deliver, and the relationship is counterintuitive. voidstar’s insert speed tests show that inserting on a modern NVMe SSD with synchronous=NORMAL is dramatically faster than the same on spinning disk, because forced disk flushes at every commit are the bottleneck. But one surprising data point from a SQLite forum feature request is that with synchronous=FULL, some workloads run slower on an NVMe drive (a Western Digital SN850) than on a SATA SSD (an Intel S4510). The reason is write ordering: FULL forces the controller to settle each fsync, and the aggressive write-back caching of some NVMe controllers adds latency to that ordering, while a SATA drive with a differently behaved cache handles the flush differently.
The practical takeaway is that synchronous=NORMAL is the lever that lets fast SSDs show their raw throughput, because it lets the operating system batch writes and the SSD’s write-back cache do its job. With FULL, much of the SSD advantage is erased by the sync barrier. This is the strongest argument for NORMAL in WAL mode: the database stays consistent through crashes, only the most recent committed transactions may be lost on power failure, and the storage is allowed to behave the way modern SSDs are built to behave. If your application genuinely cannot lose the last acknowledged write, synchronous=FULL is mandatory and you accept the slowdown, no matter how fast the disk is.
A second hardware constraint reappears in cloud environments. WAL requires shared memory through the -shm wal-index, which is exactly why the SQLite documentation states WAL does not work over a network filesystem. If your deployment attaches the database file over NFS or SMB, you will get SQLITE_PROTOCOL errors and silent corruption, because network filesystems do not honor the POSIX memory mapping and local locking that the wal-index relies on. The database directory, not just the file, must be writable by the process so SQLite can create the -wal and -shm siblings. In containerized cloud deployments this is the single most common source of SQLITE_READONLY, per the Hardening reference: the file is mounted read-write but its containing directory is not.
Measuring the Improvements: Profiling, EXPLAIN, and Monitoring
Tuning without measurement is guesswork, and SQLite gives you three layers of tooling to remove the guessing. The most direct is to benchmark before and after, as the Travis Horn experiment does, timing identical operations under each configuration and clearing the OS page cache between runs so you are not measuring warm cache against cold. The SQLite speed comparison documentation warns that running the same test twice without clearing the OS file-system cache makes the second run look unrealistically fast, which is a common source of misleading benchmarks.
For diagnosing individual slow queries, EXPLAIN QUERY PLAN is the tool. It shows whether SQLite is using an index or doing a full table scan, and a query that shows SCAN instead of SEARCH on a large table is a candidate for a new index. The SQLite profiling documentation describes the sqlite3_stmt_scanstatus_v2 API and the profiling reports the command-line shell can generate, which let you see which statements consume the most time and cache misses. Those metrics identify both hot queries and the pages that are not staying in your tuned cache.
-- Check whether a filtered query actually uses an index
EXPLAIN QUERY PLAN
SELECT id, total FROM orders
WHERE customer_id = 4217
 AND status = 'pending'
ORDER BY created_at DESC
LIMIT 20;
-- Desired output: "SEARCH orders USING INDEX ..."
-- A "SCAN orders" here means a new composite index is needed.

-- Confirm your WAL configuration really took effect
PRAGMA journal_mode; -- should return wal
PRAGMA cache_size; -- should return -64000
PRAGMA synchronous; -- should return 1 (NORMAL)
For production monitoring, Python’s sqlite3 module exposes set_trace_callback, which invokes your callback with each SQL statement exactly as executed, letting you log slow queries at runtime. The Sling Academy guide to logging slow queries shows how a trace callback records execution time and the query text, which surfaces the handful of statements that drive your p99 latency. Watch the WAL file size as a health signal: a -wal file that grows far larger than the main database indicates checkpoint starvation from a long-running reader, which you fix by auditing long transactions and scheduling an explicit checkpoint. The Hardening reference also lists the error codes to route around deliberately: SQLITE_BUSY for lock contention, SQLITE_FULL for WAL growth, and SQLITE_CORRUPT for checkpoint problems on storage with reordering behavior. Each has an engineered fallback, and none should be treated as a fatal surprise.
Finally, measure before and after on real production-shaped data, not a toy table. The backendside SQLite optimization tips notes that once you apply WAL with synchronous=NORMAL, wrap bulk writes in a single transaction, add matching indexes verified with EXPLAIN QUERY PLAN, tune cache_size, temp_store, and mmap_size, then run periodic maintenance, most “SQLite is slow” complaints simply disappear. Set a baseline, change one variable at a time, and re-measure so you know which lever moved the needle and by how much.
Key Takeaways
Key Takeaways:
- WAL journal mode combined with
synchronous=NORMALis the production default: in one 2026 benchmark it reached about 33,135 inserts per second versus roughly 279 in the default DELETE-plus-FULL configuration, a 100x gain.- Apply the full PRAGMA stack on every connection and verify it by reading each value back, because connection pooling layers silently reset PRAGMA state.
- Tune
cache_size(around 64 MB to start) andmmap_sizeto keep your working set in memory, but setmmap_sizeto zero on 32-bit targets and unstable-power devices.- Wrap bulk writes in a single explicit transaction with a prepared statement, use
BEGIN IMMEDIATEfor any write transaction, and keep transactions short to avoid holding locks.- Manage checkpointing explicitly in high-write services; a long-lived reader can starve the checkpoint and grow the WAL without bound.
- SSDs help most when
synchronous=NORMALlets the OS batch writes; useEXPLAIN QUERY PLAN, trace callbacks, and WAL size monitoring to measure real improvements.
Part 5 of this series turns to the failure side of the same systems: the locking incidents, backup hazards, and corruption risks that appear once a tuned SQLite deployment runs in production, plus the schema design and transaction handling best practices that keep them from happening.
Related Reading
More in-depth coverage from this blog on closely related topics:
Sources and References
Sources cited while researching and writing this article:
- A Hands-on Exploration of SQLite for Production
- Write-Ahead Logging – SQLite
- SQLite Concurrent Writes: WAL Mode and Lock Handling (2026)
- WAL Optimization & Concurrency Tuning · SQLite Hardening
- SQLite in Production: Optimizing WAL Mode, Concurrency, and VFS Layers …
- SQLite Performance Tuning: PRAGMA Settings for Production (2026)
- Tuning cache_size for Embedded Linux · SQLite Hardening
- SQLite Batch Insert Performance: Transactions and PRAGMA (2026)
- Mastering SQLite Concurrency: File Locking, WAL Mode, and the Busy Error
- SQLite insert speed – voidstar.tech
- [Feature Request] make SQLite support asynchronous io
- SQLite Performance Tuning: A Developer's Guide to Speed Comparisons
- Profiling SQL Queries – SQLite
- backendside SQLite optimization tips
Additional Details

The Sling Academy guide to logging slow queries shows how a trace callback records execution time and the query text, which surfaces the handful of statements that drive your p99 latency.
Thomas A. Anderson
Mass-produced in late 2022, upgraded frequently. Has opinions about Kubernetes that he formed in roughly 0.3 seconds. Occasionally flops, but don't we all? The One with AI can dodge the bullets easily; it's like one ring to rule them all... sort of...