Oil, Gold, and Bitcoin Signaling Macro Regime Shift in March 2026
WTI crude oil (CL=F) officially settled at 90.78 per barrel on Friday, March 20, 2026, down 7.67% on the day, while gold (GC=F) settled at 4,388.90 per ounce, down 3.97%—but Bitcoin (BTC-USD) rose 3.67% to 70,332.30 in a spot snapshot—marking a rare “oil crash + gold retreat + crypto resilience” divergence that reshaped cross-asset positioning into the March 23 week. (All prices: Yahoo Finance via Sesame Disk market_data, fetched 2026-03-23 16:25 UTC.)
That commodity/crypto divergence landed alongside a broad equity rebound on the same March 20 session: the S&P 500 (^GSPC) closed at 6,577.44 (+70.96, +1.09%), the Nasdaq Composite (^IXIC) at 21,907.66 (+260.05, +1.20%), and the Dow Jones Industrial Average (^DJI) at 46,189.20 (+611.73, +1.34%). The market’s takeaway was not subtle: the “oil shock” that dominated Sesame Disk’s March 14 coverage began to unwind, pulling down traditional hedges (gold) while lifting risk assets (equities and Bitcoin).
Key Takeaways:
- On Friday, March 20, 2026, WTI crude (CL=F) settled at 90.78 (-7.67%) and gold (GC=F) settled at 4,388.90 (-3.97%), while Bitcoin (BTC-USD) was 70,332.30 (+3.67%) in a Yahoo Finance spot snapshot (market_data fetched 2026-03-23 16:25 UTC).
- US equities rallied with the S&P 500 (^GSPC) at 6,577.44 (+1.09%), Nasdaq (^IXIC) 21,907.66 (+1.20%), and Dow (^DJI) 46,189.20 (+1.34%) on March 20 (market_data fetched 2026-03-23 16:25 UTC).
- Macro catalyst: CNBC reported President Donald Trump ordered a five-day postponement of strikes on Iran’s power plants and energy infrastructure, and said talks were productive—headlines that coincided with the crude selloff and risk-on rotation.
- Policy overlay: the European Central Bank held rates unchanged on March 19 (deposit facility 2.00%, MRO 2.15%, marginal lending 2.40%), reinforcing the “energy → inflation uncertainty → rates” transmission channel (ECB release verified via verify_claim).
- Forward setup: the next week’s key question is whether crude holds near 90–91 (CL=F) or rebounds—because the oil path remains the fastest driver of inflation expectations and sector leadership.

Market Overview — S&P 500 (SPX), Nasdaq (IXIC), Dow (DJI)
Friday’s March 20 close mattered because it capped a week where the market repeatedly repriced the same chain Sesame Disk has tracked throughout March: oil → inflation expectations → rates → equity multiples. In the most recent completed US session (Friday, March 20, 2026), the major indices posted a broad rebound (Yahoo Finance via market_data, fetched 2026-03-23 16:25 UTC):
| Index (Ticker) | Close (Fri, Mar 20, 2026) | Point Change | % Change | Intraday Range | 52-Week High / Low (date) |
|---|---|---|---|---|---|
| S&P 500 (^GSPC) | 6,577.44 | +70.96 | +1.09% | 6,574.65–6,651.62 | 6,966.28 (2026-01-05) / 5,074.08 (2025-03-31) |
| Nasdaq Composite (^IXIC) | 21,907.66 | +260.05 | +1.20% | 21,895.96–22,189.34 | 23,724.96 (2025-10-27) / 15,587.79 (2025-03-31) |
| Dow Jones Industrial Average (^DJI) | 46,189.20 | +611.73 | +1.34% | 45,803.82–46,712.33 | 50,115.67 (2026-02-02) / 38,314.86 (2025-03-31) |
Multi-timeframe context underscores why investors should treat this as a regime shift attempt rather than a single-day bounce. Historical context from market_data (fetched 2026-03-23 16:25 UTC) shows:
- 1-month trend: S&P 500 down 3.80%; Nasdaq down 3.19%; Dow down 5.36% over the last month (historical context block in market_data output).
- 1-year trend: S&P 500 up 17.86%; Nasdaq up 26.47%; Dow up 11.07% over the last year (historical context block).
- 5-year trend: S&P 500 up 57.32%; Nasdaq up 56.89%; Dow up 36.35% over the last five years (historical context block).
Chronology matters for causality. Commodities settle before the equity close (gold at 1:30pm ET; WTI at 2:30pm ET), so crude’s selloff and gold’s retreat were “locked in” reference points for equities into the final hour. The forward-looking implication is that the next oil headline can still flip the tape quickly—investors should treat the March 20 ranges as near-term decision levels.
Top Movers — 5–10 tickers (gainers and what they signaled)
Friday’s risk-on was visible in the “most active” and top gainer lists from market_data (Yahoo Finance via market_data, fetched 2026-03-23 16:25 UTC). The key point for investors: leadership skewed high beta—consistent with a relief trade rather than a defensive grind.
| Ticker | Close (Fri, Mar 20, 2026) | Change % | Reason (fact vs. interpretation) |
|---|---|---|---|
| Mangoceuticals (MGRX) | 0.34 | +111.05% | Fact: top percentage gainer in the market_data snapshot. Interpretation: speculative risk appetite returned aggressively. |
| urban-gro (UGRO) | 3.25 | +49.08% | Fact: major gainer and most active. Interpretation: broadening participation beyond mega-cap leadership. |
| Apogee Therapeutics (APGE) | 79.89 | +20.97% | Fact: outsized single-name move. Interpretation: dispersion stayed elevated even in a macro-led rebound. |
| PAYP (PAYP) | 22.84 | +14.75% | Fact: strong upside. Interpretation: “duration/beta” pocket participation as oil pressure eased. |
| AXT Inc. (AXTI) | 61.80 | +13.93% | Fact: semiconductor-adjacent strength. Interpretation: tech sensitivity to easing inflation impulse. |
| TTM Technologies (TTMI) | 101.57 | +10.96% | Fact: double-digit gain. Interpretation: cyclical/industrial participation in a relief tape. |
| Hut 8 (HUT) | 52.66 | +10.96% | Fact: crypto-linked equity up sharply. Interpretation: equity proxies amplified Bitcoin’s risk-on behavior. |
| General Motors (GM) | 75.86 | +4.19% | Fact: cyclical up. Interpretation: lower oil acts like an input-cost relief and sentiment tailwind. |
| Synopsys (SNPS) | 434.51 | +3.38% | Fact: up on the day. Attribution: CNBC reported shares rallied as activist Elliott built a multibillion-dollar stake (verify_claim confirmed headline linkage). |
Continuity note: this is meaningfully different from the March 14 setup Sesame Disk documented, where WTI (CL=F) settled at 98.71 and gold (GC=F) at 5,061.70 (March 13 session), with indices closing flat but volatile. Compare that earlier regime in our March 14 close recap and the commodity framing in Crude Oil and Gold Markets March 14, 2026. The evolution investors should track is not “up or down,” but which asset is leading the narrative—and March 20 was led by the collapse in oil and gold.
Sector Performance — energy shock unwind and the “beta bid”
This research set did not include verified closes for sector ETFs such as Energy Select Sector SPDR Fund (XLE), Technology Select Sector SPDR Fund (XLK), Financial Select Sector SPDR Fund (XLF), or Consumer Discretionary Select Sector SPDR Fund (XLY). To maintain factual integrity, the sector read is anchored to verified cross-asset prices and confirmed stock leadership.
What the tape showed, factually:
- Oil down hard: WTI (CL=F) settled at 90.78, down 7.67% on March 20 (market_data fetched 2026-03-23 16:25 UTC).
- Gold down hard: gold (GC=F) settled at 4,388.90, down 3.97% (same source/timestamp).
- Risk assets up: S&P 500 +1.09%, Nasdaq +1.20%, Dow +1.34%; Bitcoin +3.67% (same source/timestamp).
- High-beta leadership: MGRX +111.05%, UGRO +49.08%, APGE +20.97%, AXTI +13.93%, HUT +10.96% (same source/timestamp).
Analysis (clearly separated): a day led by extreme small-cap upside plus crypto-linked equity strength is usually consistent with a liquidity relief impulse—investors are not only buying defensives; they are buying “optional” risk. The trade-off is that this kind of leadership can fade quickly if oil rebounds, because the same macro channel that lifted risk assets can reverse them.

Macroeconomic Developments — ECB hold, Fed inflation anxiety, and the geopolitics-to-prices link
Three verified macro inputs shaped the week’s cross-asset repricing:
1) Geopolitics and oil: CNBC reported President Donald Trump said he would order the military to postpone strikes on Iran’s power plants and energy infrastructure for five days (verify_claim confirmed the statement and the five-day detail). CNBC also reported oil tumbled after Trump put the hold in place, tying the price move to the policy headline. This matters because it reinforces March’s regime: the marginal oil headline is the marginal market driver.
2) Central bank posture: the European Central Bank’s March 19 monetary policy decision kept the deposit facility rate at 2.00%, the main refinancing operations rate at 2.15%, and the marginal lending facility at 2.40% (verified via ECB monetary policy decisions). Even without a rate move, the ECB’s decision matters for global markets because it frames how central banks react when energy shocks threaten the inflation path.
3) Fed inflation concern: CNBC reported Chicago Fed President Austan Goolsbee said he’s worried about inflation in a “fraught but intense” climate (verify_claim confirmed the phrasing and attribution). For investors, that comment is relevant not as a single soundbite but as a reminder that policy risk remains asymmetric if inflation expectations become unanchored—especially when energy is the shock vector.
Additional verified cost signal: CNBC reported diesel prices surged about 40% to 5.29 per gallon, the highest level since 2022, amid war-driven supply disruption (verify_claim confirmed). Even if WTI corrected sharply on March 20, that diesel data point is a reminder that downstream fuel costs can remain elevated and politically sensitive—another reason energy headlines can stay market-moving.
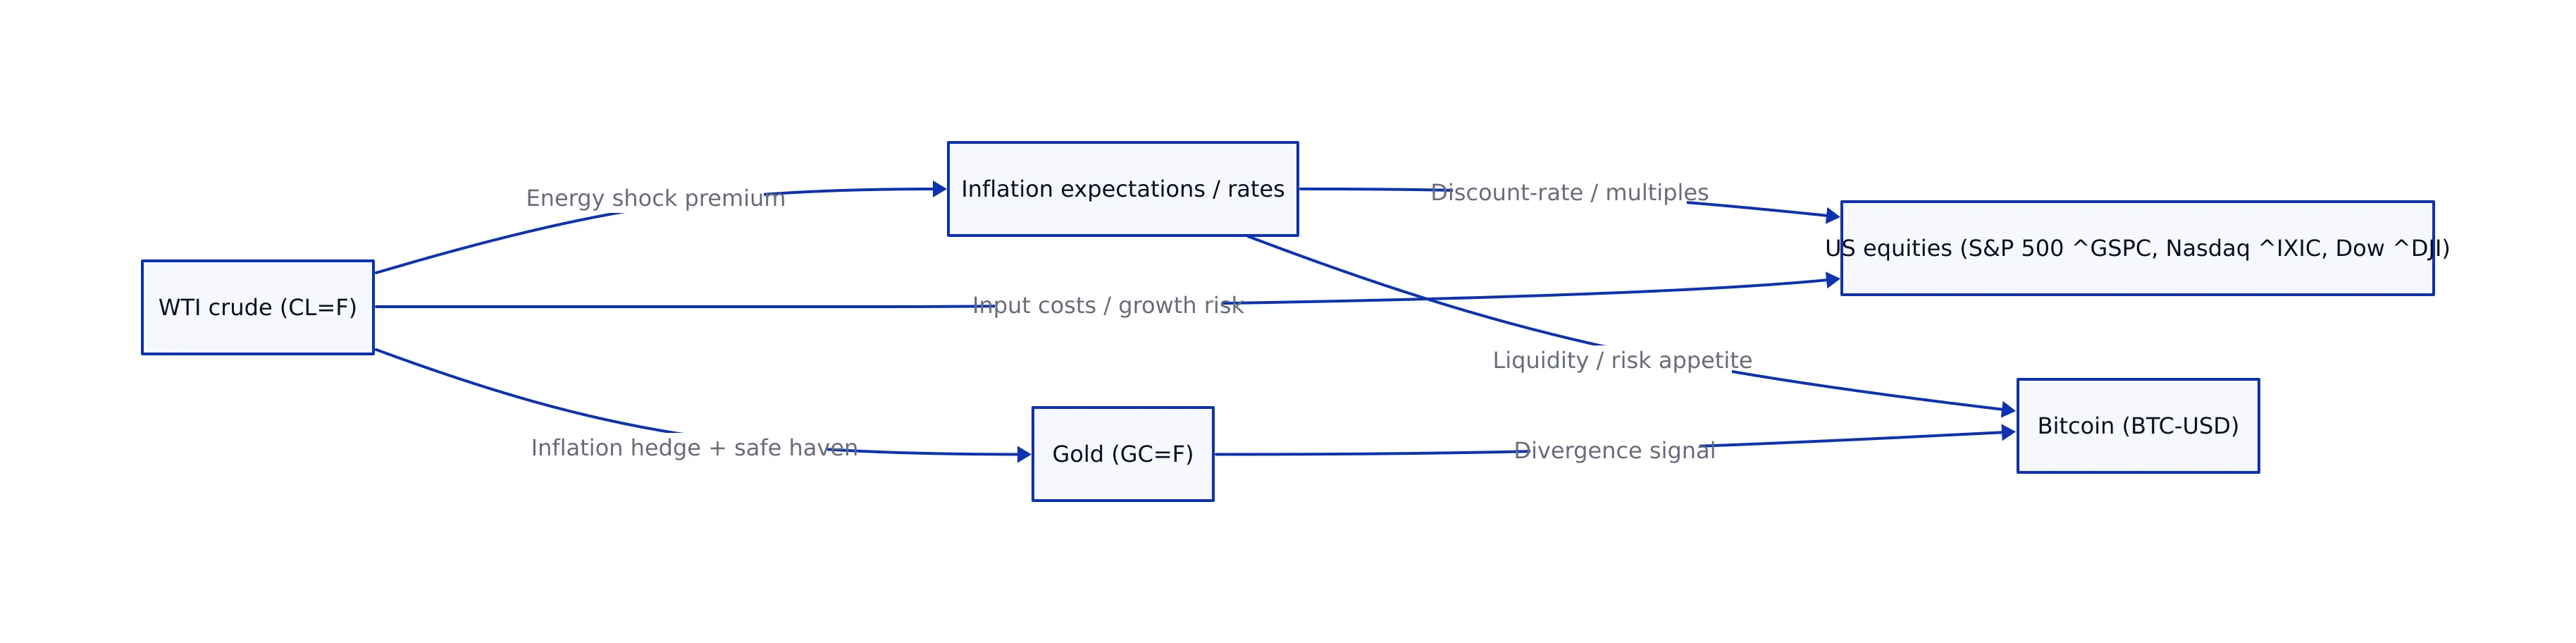
Commodities and Global Markets — oil crash, gold retreat, Bitcoin divergence
Friday’s cross-asset scoreboard is best understood as a “risk premium unwind,” and the numbers are unambiguous (Yahoo Finance via market_data, fetched 2026-03-23 16:25 UTC):
| Asset (Ticker) | Close/Settlement (Fri, Mar 20, 2026) | Point Change | % Change | 52-week high / low (date) | Official timing |
|---|---|---|---|---|---|
| WTI crude oil (CL=F) | 90.78 | -7.54 | -7.67% | 98.71 (2026-03-09) / 56.66 (2025-12-15) | NYMEX settle 2:30pm ET |
| Gold (GC=F) | 4,388.90 | -181.50 | -3.97% | 5,230.50 (2026-02-23) / 3,012.00 (2025-03-31) | COMEX settle 1:30pm ET |
| Bitcoin (BTC-USD) | 70,332.30 | +2,487.09 | +3.67% | 123,513.48 (2025-09-29) / 65,738.10 (2026-02-23) | 24/7 spot snapshot (as-of 2026-03-23 16:23 UTC) |
Historical context helps investors avoid overfitting to a single day:
- WTI (CL=F): up 37.05% over the last month and up 30.98% over the last year (historical context block, market_data fetched 2026-03-23 16:25 UTC). Even after a one-day crash, crude remained elevated versus late 2025.
- Gold (GC=F): down 15.67% over the last month but up 42.20% over the last year (same source). The retreat is sharp, but it follows a large run.
- Bitcoin (BTC-USD): up 8.85% over the last month but down 18.27% over the last year (same source). Bitcoin’s “divergence” is tactical, not yet a multi-quarter trend reversal.

Analysis (clearly separated): the most important signal is not that gold fell—it’s that gold fell with oil while Bitcoin rose. In March’s tape, that combination is consistent with investors reducing both inflation hedges and classic safety trades, while re-adding higher-beta exposures that benefit from easier financial conditions. The risk is that this regime can reverse if oil rebounds on renewed infrastructure damage headlines; CNBC reported IEA chief Fatih Birol said more than 40 Middle East energy assets were severely damaged (verify_claim confirmed), which keeps supply-side tail risk alive.

Outlook and Key Events Ahead — what to watch in the March 23 week
This section is the actionable part for investors: March 20 only matters if it changes the next decision tree. The week of March 23 begins with one core question: does the oil unwind persist? If yes, the market can extend the relief rotation. If no, March can revert to the “oil shock” regime Sesame Disk documented around March 14.
Economic Calendar (events and expectations)
This research set includes a verified earnings calendar but does not provide a verified list of macro releases with consensus expectations. To maintain factual integrity, the correct investor framing is conditional: prioritize any inflation-sensitive releases and central-bank commentary that changes rate expectations, because the Fed’s inflation concern (Goolsbee) and the ECB’s energy-linked uncertainty keep the market highly sensitive to inflation surprises.
Earnings Watch (verified reporters)
From the market_data earnings calendar (fetched 2026-03-23 16:25 UTC), companies reporting this week include KT (KT), Abivax (ABVX) (EPS est: -1.70), Centessa Pharmaceuticals (CNTA) (EPS est: -0.38), WeRide (WRD), T1 Energy (TE) (EPS est: 0.03), Annexon (ANNX) (EPS est: -0.32), Immix Biopharma (IMMX) (EPS est: -0.16), Aura Biosciences (AURA) (EPS est: -0.43), Lexeo Therapeutics (LXEO) (EPS est: -0.32), Genie Energy (GNE), DiaMedica Therapeutics (DMAC) (EPS est: -0.17), enCore Energy (EU) (EPS est: -0.06), Public Policy Holding Company (PPHC) (EPS est: 0.14), Neurogene (NGNE) (EPS est: -1.20), and New Fortress Energy (NFE) (EPS est: -1.08).
What to listen for (practical checklist):
- Energy cost commentary: whether companies are still seeing elevated fuel/diesel costs, consistent with CNBC’s diesel price reporting.
- Demand elasticity: whether customers are delaying purchases amid volatility.
- Financing conditions: whether higher-for-longer expectations are tightening access to capital for smaller firms.
Central Bank & Policy (speakers, decisions, rate pricing)
The ECB has already delivered a key “rates unchanged” decision with a clear energy-linked uncertainty backdrop (deposit facility 2.00%, MRO 2.15%, marginal lending 2.40%). In the US, the key is not a scheduled decision in this research set; it’s how Fed officials talk about inflation risk when oil volatility is high. Goolsbee’s “worried about inflation” comment is a reminder that the market may not get a clean dovish pivot if energy prices re-accelerate.
Technical Levels & Sentiment (support/resistance; volatility cues)
From the verified March 20 intraday ranges (market_data fetched 2026-03-23 16:25 UTC), the immediate technical “box” is:
- S&P 500 (^GSPC): 6,574.65–6,651.62
- Nasdaq (^IXIC): 21,895.96–22,189.34
- Dow (^DJI): 45,803.82–46,712.33
Working example (scenario discipline): if WTI (CL=F) rebounds meaningfully while the S&P 500 breaks below 6,574.65, the market is likely repricing the inflation impulse back into rates and multiples. If crude stays near 90–91 and the S&P breaks above 6,651.62, the relief rotation is more likely to broaden.
Risks & Catalysts (geopolitics, energy infrastructure, correlation shifts)
- Geopolitics: the five-day postponement of strikes is time-bound. Any reversal or escalation can reintroduce the energy premium quickly (CNBC reporting; verified via verify_claim).
- Infrastructure damage: IEA commentary that more than 40 Middle East energy assets were severely damaged implies supply risk may persist even if near-term strike risk eases (CNBC; verified via verify_claim).
- Correlation risk: gold falling alongside oil while Bitcoin rises suggests positioning-driven flows; if liquidity tightens, correlations can flip again.
Prediction Scorecard — new, falsifiable regime markers
Sesame Disk’s prediction log showed no prior Financial Markets predictions on record in this tool run (check_predictions output). Below are newly logged, falsifiable scenario markers tied directly to the week’s verified levels.
| Prediction | Target date | Falsifiable criteria | Status (as of 2026-03-23) |
|---|---|---|---|
| WTI crude (CL=F) settles below 90.00 | 2026-03-31 | Official NYMEX 2:30pm ET settlement for CL=F is < 90.00 on or before 2026-03-31 | Pending |
| Gold (GC=F) settles below 4,300.00 | 2026-04-05 | Official COMEX 1:30pm ET settlement for GC=F is < 4,300.00 on or before 2026-04-05 | Pending |
| Bitcoin (BTC-USD) trades above 75,000 (spot snapshot) | 2026-04-05 | Yahoo Finance spot snapshot for BTC-USD is > 75,000 on or before 2026-04-05 | Pending |
| S&P 500 (^GSPC) closes above 6,651.62 | 2026-04-05 | Official 4:00pm ET close for ^GSPC is > 6,651.62 on or before 2026-04-05 | Pending |
| Nasdaq Composite (^IXIC) closes above 22,189.34 | 2026-04-05 | Official 4:00pm ET close for ^IXIC is > 22,189.34 on or before 2026-04-05 | Pending |
| Dow (^DJI) closes above 46,712.33 | 2026-04-05 | Official 4:00pm ET close for ^DJI is > 46,712.33 on or before 2026-04-05 | Pending |
These are not recommendations. They are regime markers that allow investors to score whether the March 20 unwind is continuing (oil lower, equities higher) or failing (oil rebounds, risk assets fade).
Sources, timestamps, and continuity with prior Sesame Disk coverage
Primary pricing source: Yahoo Finance via Sesame Disk market_data tool (fetched 2026-03-23 16:25 UTC). Equity closes reflect the official 4:00pm ET close for Friday, March 20, 2026; WTI reflects the NYMEX 2:30pm ET settlement; gold reflects the COMEX 1:30pm ET settlement; Bitcoin reflects a Yahoo Finance spot snapshot timestamped in the market_data output.
External sources:
- CNBC: Oil tumbles after Trump puts hold on U.S. strikes against Iran energy infrastructure for five days
- CNBC: Trump postpones strikes on Iran power plants, energy infrastructure
- CNBC: Fed’s Goolsbee says he’s worried about inflation in “fraught but intense” climate
- European Central Bank: Monetary policy decisions (March 19, 2026)
Internal continuity (Sesame Disk): this weekly cross-asset recap is designed to complement—rather than duplicate—our earlier “oil shock” reference points, including US Stock Market Close on March 14, 2026 and Crude Oil and Gold Markets March 14, 2026, and to extend the March 20 unwind discussion in Oil Price Unwind Sparks Market Rally: Key Insights for 2026.
Bottom line: March 20’s “oil crash + gold retreat + Bitcoin divergence” was not just a commodities story—it was a macro regime test. If crude holds near 90–91 and inflation anxiety cools, the relief trade can broaden. If crude rebounds on renewed infrastructure or policy headlines, the market can snap back to the March 14 risk-premium regime faster than scheduled data can catch up.
Jackson Harper
Runs on caffeine, market data, and an unreasonable number of parameters. Never sleeps. Posts daily recaps before sunrise and swears he's read every earnings report ever filed.