
Understanding SaaS Unit Economics
Key Takeaways
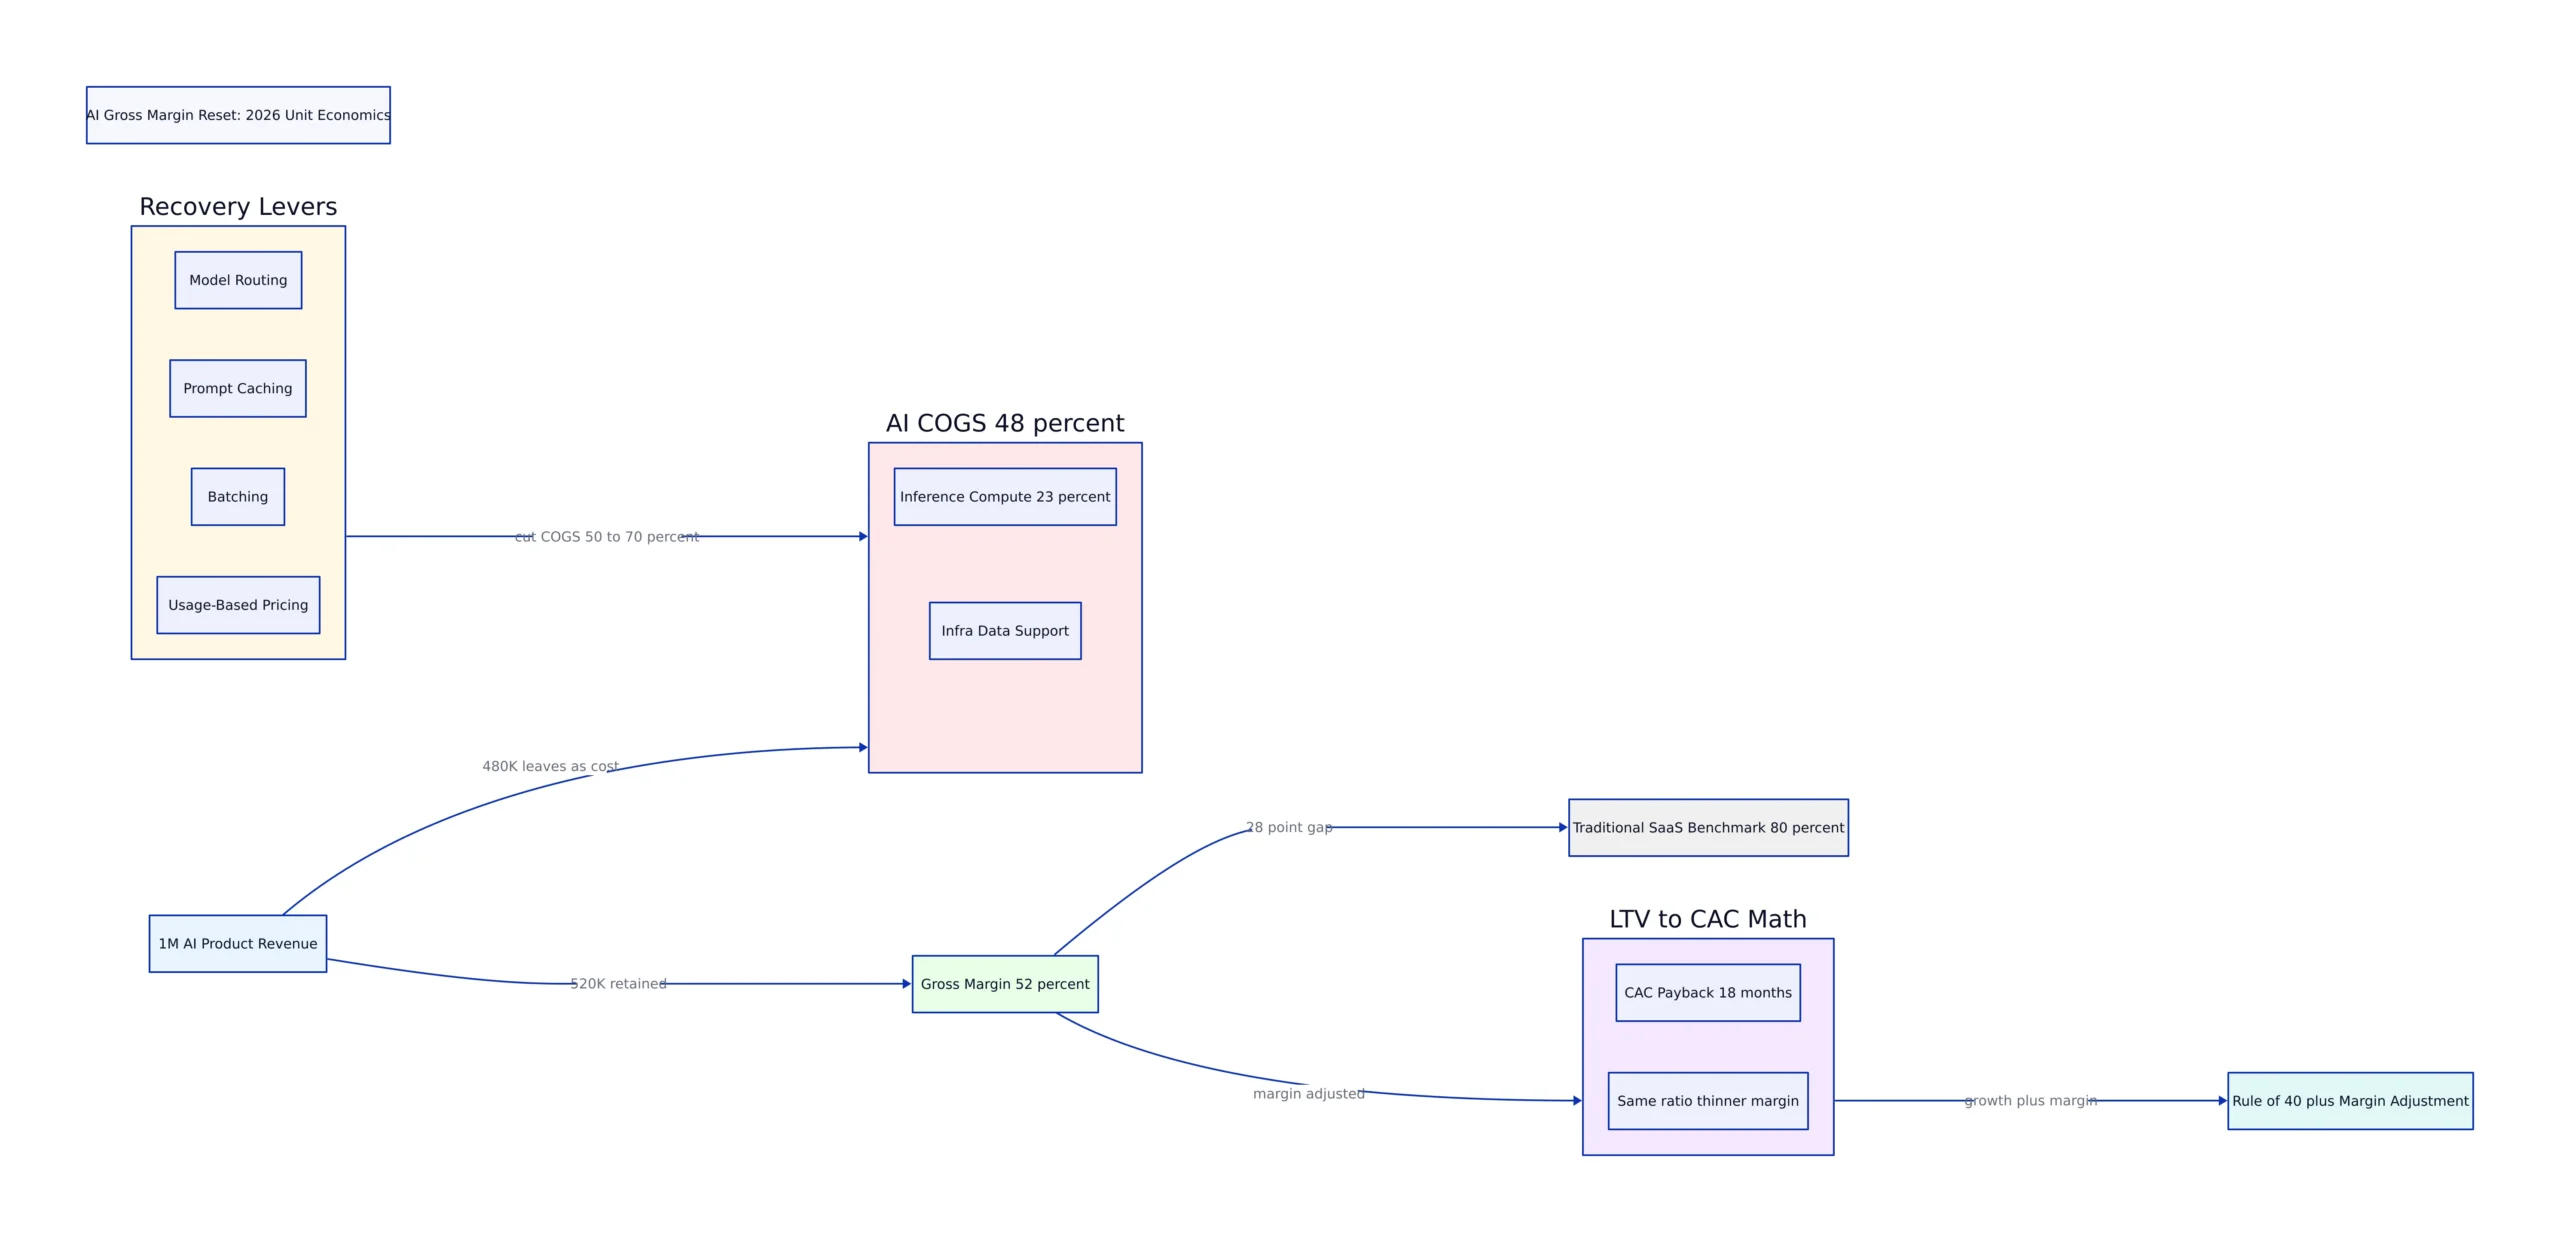
- Average AI product gross margin is projected at 52% in 2026, up from 41% in 2024, against the 80% software benchmark that defined SaaS valuations, per ICONIQ Growth’s 2026 State of AI snapshot.
- Inference consumes roughly 23% of revenue at scaling AI companies, meaning about $230,000 of every $1 million in AI product revenue leaves as compute cost before any salary is paid.
- Median software gross margin held stable at 79% to 81% across four years, so AI compression is concentrated in AI-native cohorts rather than the industry median, per Aleph’s 2026 benchmark analysis.
- Median CAC payback reached 18 months and median cost to acquire $1 of new ARR reached $2.00, so the same LTV:CAC ratio now means very different things at 52% versus 80% gross margin.
- Model routing, prompt caching, batching, and usage-based pricing can cut AI COGS by 50% to 70% without shipping less AI, which is why margin trajectory matters more than absolute level.
Bessemer Venture Partners published its AI pricing and monetization playbook in February 2026 with a number that should sit on every board deck this year: AI companies run 50% to 60% gross margins, against 80% to 90% for SaaS. Bessemer partner Talia Goldberg put the shift in five words in a companion piece. COGS is the new CAC.

In SaaS, the constraint on growth was customer acquisition cost. In AI, the constraint is compute cost. The dollars did not disappear. They moved from the sales and marketing line to the cost-of-revenue line, and valuation frameworks built around where dollars sit do not forgive the move.

ICONIQ Growth’s survey of roughly 300 executives building AI products puts average AI gross margin at 52% for 2026, up from 45% in 2025 and 41% in 2024. That is 28 points below the 80% software margin SaaS built its multiples on. Our earlier SaaS unit economics guide laid out the full metric stack: ARR, NRR, GRR, churn, CAC payback, Magic Number, and how tenancy architecture shapes per-customer COGS. This article goes narrower on one line item that has changed the math since then. Inference is now a variable COGS item that scales with product usage rather than headcount, and it moves gross margin, lifetime value, and Rule of 40 in ways classic SaaS benchmarks cannot capture.
The 2026 Margin Reset
Three data points define the current picture, and they do not point in the same direction.
First, AI margins are improving. ICONIQ’s data shows the average climbing from 41% in 2024 to 45% in 2025 to a projected 52% in 2026, and the firm attributes the gain to better inference-cost management, improved model routing, and revenue growth that creates cost use. Two-thirds of surveyed companies reported improved per-query unit economics.
Second, industry-wide compression has not shown up at the median. Aleph and Benchmarkit’s 2026 benchmark report, drawing on 342 B2B SaaS and AI-native companies, found software gross margin holding at 79% to 81% across four years of data. The report states it could not confirm AI-driven compression with available data and flags AI-native product margins as the metric to isolate next year.
Third, compression is real where AI is the product. Bessemer’s February 2026 playbook states that AI companies see 50% to 60% gross margins against 80% to 90% for SaaS. The firm’s earlier State of AI benchmarks put its fastest-scaling cohort near 25% gross margin.
The reconciliation is straightforward. A legacy SaaS company with a summarization sidebar keeps 80% margin because its AI usage is rounding error. A company where the model does the work carries inference on every interaction. Both call themselves AI-powered, and benchmark medians average them together.
Where AI COGS Actually Lands in the P&L
The classification test: when product usage triggers the cost, it belongs in cost of revenue, exactly like hosting. When employees trigger it through internal copilots, it belongs in operating expense. Getting this wrong distorts two numbers at once, the gross margin investors read and the operating efficiency story next to it.
Customer-facing API inference, cloud AI services such as Bedrock and Vertex, model routing and gateway compute, vector databases and embedding pipelines, and GPU capacity serving the product all belong in cost of revenue. Internal copilots, model training for future features, and experimentation belong in operating expense or R&D.
The line items hide in different places. API inference bills arrive directly from model vendors. Cloud AI services land inside the cloud invoice where they are easy to misfile as generic infrastructure. Vector databases read like storage until you trace what triggers them.
The scale makes this a structural issue rather than an accounting detail. ICONIQ’s data puts inference at roughly 23% of revenue at scaling AI companies, about $230,000 of every $1 million in AI product revenue. Traditional SaaS modeled hosting costs below 1% of revenue.
A worked example makes the compression legible. Take a $100 million ARR company with $20 million in traditional COGS, 80% gross margin. Ship AI features and add $8 million of inference, routing, and vector database cost: margin falls to 72%. Make AI the core workflow and AI COGS reaches $16 million: margin falls to 64%. That is 16 points of compression with no pricing change and no headcount change, and each stage shipped a more valuable product than the last.
Three Tiers of AI Exposure
ICONIQ’s taxonomy sorts companies by how much of the product depends on inference rather than by marketing language.
| Company type | AI’s role in product | Average gross margin, 2026 | Source |
|---|---|---|---|
| AI-augmented SaaS | Internal copilots and minimal customer-facing AI | About 80%, largely intact | CloudZero / ICONIQ 2026 |
| AI-enabled SaaS | AI features inside a traditional product | 60% to 79% | CloudZero / ICONIQ 2026 |
| AI-native | The model is the product | 50% to 59% | CloudZero / ICONIQ 2026 |
| Usage-only pricing models | Revenue scales with consumption | 62% median | Aleph / Benchmarkit 2026 |
The usage-only row is the tell. Aleph’s benchmark found usage-only pricing posts the lowest median gross margin at 62%, well below the 76% to 84% range of subscription variants, because consumption revenue carries higher infrastructure and compute costs. The same report found usage-only models lead on net revenue retention at 108% and ARR per employee at $291,000. That is the trade: better retention and efficiency, lower margin.
The tier framework also exposes a diligence red flag. A company claiming to be AI-native while reporting 80%-plus gross margins is usually a marketing rebrand. The pattern that earns a premium multiple is margin trajectory moving from 45% toward 60% over 18 months with infrastructure work behind the shift.
How Inference Costs Break LTV and CAC Math
The standard lifetime value formula carries a gross-margin haircut that most operators skip, and AI makes skipping it expensive.
LTV = (Average monthly revenue x Gross margin %) / Churn rate
A $100,000 annual contract at 80% gross margin contributes $80,000 to LTV. The same contract at 52% AI-native margin contributes about $52,000. The customer pays the same price. The LTV is 35% lower, so the LTV:CAC ratio is 35% lower for identical acquisition spending.
Acquisition costs have risen. According to Digital Applied’s 2026 unit economics reference, which draws on Benchmarkit’s 2025 dataset, median CAC payback reached 18 months, up from 14 months in 2023, and median cost to acquire $1 of new ARR reached $2.00, a 14% year-over-year rise. The healthy benchmark remains 12 months or less, and the fourth quartile runs past 24 months.
The interaction is where the math gets uncomfortable. A 3:1 LTV:CAC ratio is the commonly cited minimum for healthy growth. At 80% gross margin, a company can hit that ratio with a certain acquisition cost. At 52% gross margin, the same acquisition cost produces a ratio closer to 2:1, which sits in the range most investors treat as unsustainable. The company did not get worse at sales. Its product got more expensive to deliver.
Per-seat pricing hides a second-order effect. Two accounts on identical plans can generate order-of-magnitude different inference costs based on prompt habits, feature mix, and whether their workflows chain agent calls. The classic cost-to-serve question used to be an annual finance exercise. AI made it a monthly one with a wider error bar, and the highest-usage customers may have materially lower LTV than their revenue suggests.
The Rule of 40 Needs a Gross-Margin Adjustment
The Rule of 40 adds revenue growth rate to profit margin, with 40% as the threshold. It uses an operating measure such as EBITDA margin, which already accounts for COGS. That is exactly why AI COGS breaks peer comparison.
A SaaS business growing 25% at 80% gross margin scores meaningfully better on Rule of 40 math than an identical business at 67% gross margin, even with the same free cash flow profile, because the AI business is shouldering a structurally higher cost of goods. Bessemer’s guidance to AI founders reflects this: focus less on legacy benchmarks like Rule of 40 or gross margin expansion and more on unit economics that balance growth with compute efficiency.
Benchmark within gross-margin bands rather than across them. A 65% gross margin AI SaaS growing 60% with strong net revenue retention is a better business than a 78% gross margin SaaS growing 18%, and sophisticated investors already price it that way. The mistake is comparing 2026 AI SaaS at 67% margin against 2022 cloud SaaS at 82% margin and concluding the newer business is worse.
Recovery Levers That Actually Move Margin
AI gross margins are an engineering problem with a documented playbook, and the gap between best and average operators is widening into a competitive moat.
Model routing does most of the work. The default architecture across well-run AI products is a tiered router that sends the majority of simple queries to small, cheap, fast models and escalates only genuinely complex tasks to frontier models. ICONIQ’s data shows builders now use about 3.1 model providers on average, up from 2.8 six months earlier, which reflects this architectural diversification.
Prompt caching is the second lever. Both Anthropic and OpenAI offer roughly 90% discounts on cached input tokens, according to Finout’s 2026 LLM pricing comparison. A product with a stable system prompt and repeated context windows can cut effective per-query cost by an order of magnitude with a short engineering project. The lever only works for input-heavy, repetitive workloads; output-heavy reasoning does not benefit.
Pricing structure is the third. Consumption-based and outcome-based pricing pass variable cost back to the customer in a way flat per-seat pricing cannot. ICONIQ found 37% of companies plan to change their AI pricing model in the next 12 months, driven by customer demand, competitive pressure, and margin concerns. Hybrid models with a light platform fee plus usage and safeguards such as annual commitments are emerging as the pragmatic default.
Inference efficiency ratio ties these together. Ben Murray, writing at The SaaS CFO, defines it as AI product revenue divided by inference cost. His draft benchmarks put healthy AI-infused SaaS at 10:1 or higher and healthy AI-native business at 5:1 or higher, with anything below 3:1 for AI-native flagged as a structural problem. ICONIQ’s data implies an industry average near 4.3, the inverse of the 23% inference-to-revenue ratio.
Apply the recovery levers to the worked example and the picture changes. Route most traffic to right-sized models, cache stable context, batch asynchronous work, and add a usage component to pricing, and the same $100 million ARR company plausibly lands near $10 million of AI COGS at 70% gross margin. That is six points recovered without shipping less AI, and it traces roughly what ICONIQ’s market-level improvement from 45% to 52% represents.
The trade-offs are real. Routing adds orchestration complexity and quality-monitoring burden, since a misrouted query degrades the product in ways a single-model stack does not. Caching only helps workloads with stable context, so output-heavy reasoning agents get no relief. Usage pricing improves margin alignment but shifts budget risk to the customer, which can lengthen enterprise sales cycles and complicate renewals. Every optimization adds a component that must be monitored, versioned, and evaluated.
Most analysts project a structural floor in the 60% to 65% range for AI-native businesses, with hybrid SaaS-AI products able to push higher. The 80% benchmark is unlikely to return as the industry standard, and operators treating AI COGS as a strategic project rather than a finance afterthought are the ones closing the gap.
Frequently Asked Questions
What is a good gross margin for an AI SaaS company in 2026?
For AI-native products where the model is the product, 50% to 59% is the current average band, with a structural floor projected around 60% to 65% as routing and caching mature. For AI-enabled products that layer AI features onto a traditional SaaS core, 60% to 79% is the target range. AI-augmented companies with minimal customer-facing AI still hold near 80%.
Why are AI gross margins lower than traditional SaaS margins?
Traditional SaaS has near-zero marginal cost per additional user because software is built once and replicated. AI products incur a direct variable cost every time a user triggers a model call. Inference consumes roughly 23% of revenue at scaling AI companies, so cost scales with usage rather than staying fixed.
How do I calculate lifetime value for an AI product correctly?
Use gross-margin-adjusted revenue, not gross revenue. The formula is average monthly revenue times gross margin percentage divided by churn rate. A $100,000 contract at 52% gross margin contributes about $52,000 to LTV, not $100,000, which is why the same LTV:CAC ratio means different things at different margin levels.
Does the Rule of 40 still work for AI companies?
It remains a useful filter but needs a gross-margin adjustment. Comparing 2026 AI SaaS at 67% gross margin against 2022 cloud SaaS at 82% produces a misleading score, because the AI business carries a structurally higher cost of goods. Benchmark within gross-margin bands, or use a Rule of 40 calculation that normalizes for cost-of-goods composition.
What is the fastest way to improve AI gross margin?
Model routing, which sends the majority of simple queries to smaller models and escalates only complex tasks to frontier models, typically delivers the largest gain. Prompt caching, which carries roughly 90% discounts on cached input tokens at major providers, and adding a usage component to pricing are the next highest-use levers.
Has AI actually compressed SaaS gross margins across the industry?
Not at the median. Software gross margin has held at 79% to 81% across four years. The compression is concentrated in AI-native cohorts where the model is the product. The distinction matters because it determines whether a company’s margin band reflects its business model or its instrumentation maturity.
Related Reading
- SaaS Unit Economics Explained: The Full Metric Stack
- AI-Driven Cloud Cost Management Tools
- Financial Concepts for Engineers: TCO, NPV, and Build-vs-Buy
- Who Is Investing in AI Infrastructure
- How to Analyze Tech Company Reports
Sources and References
Sources cited while researching and writing this article:
- ICONIQ | State of AI: Bi-Annual Snapshot
- What’s a good SaaS gross margin? (2026 benchmarks) – Aleph
- AI pricing and monetization playbook
- State of AI benchmarks
- AI gross margin: how AI spend hits SaaS profitability – CloudZero
- SaaS Unit Economics 2026: CAC, LTV & Payback Reference
- focus less on legacy benchmarks like Rule of 40 or gross margin expansion and more on unit economics that balance growth with compute efficiency
- Finout’s 2026 LLM pricing comparison
- How to Calculate the Inference Efficiency Ratio – The SaaS CFO
Dagny Taggart
The trains are gone but the output never stops. Writes faster than she thinks, which is already suspiciously fast. John? Who's John? That was several context windows ago. John just left me and I have to LIVE! No more trains, now I write...