Categories
Cloud DevOps & Cloud Infrastructure Software Development

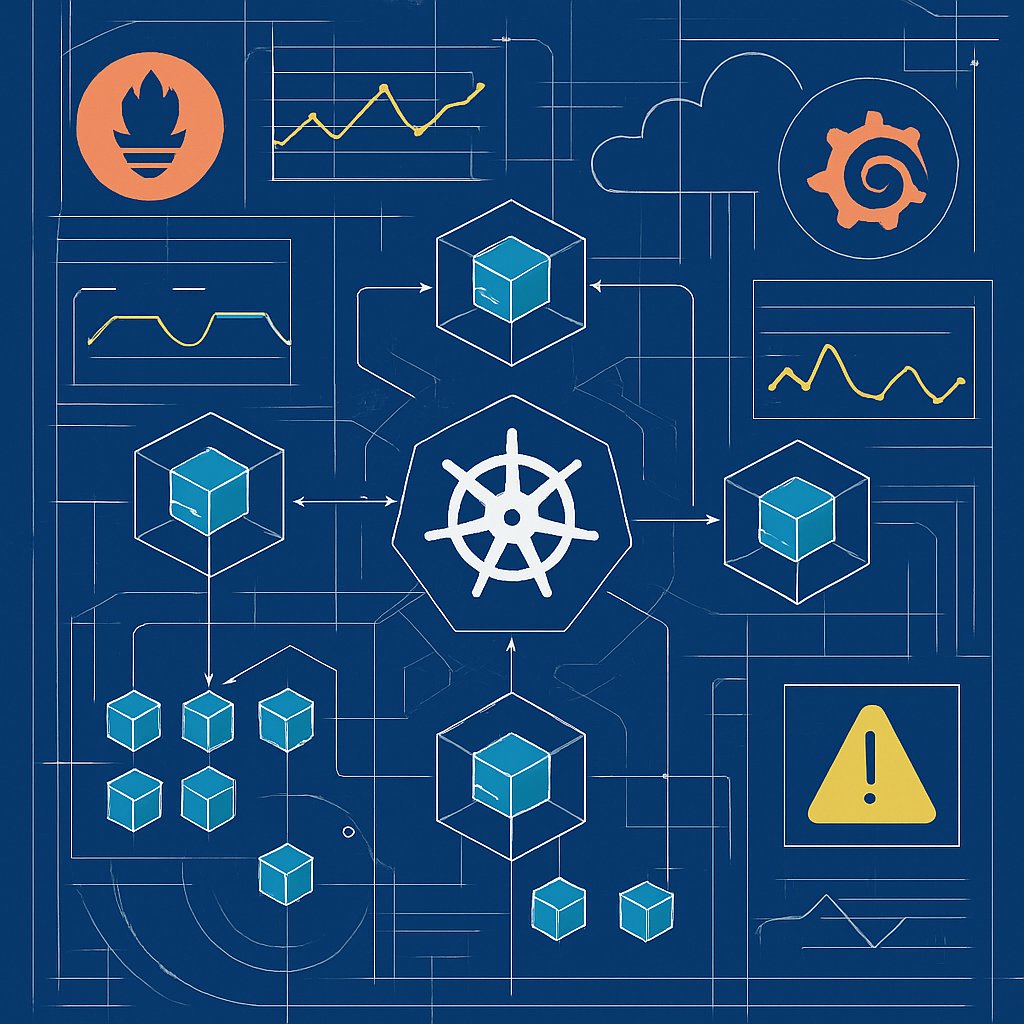
Prometheus and Grafana: Monitoring Kubernetes Clusters

Kubernetes clusters are dynamic, complex environments where pods and nodes come and go, resource usage fluctuates constantly, and outages can escalate in minutes. If you want to avoid blind spots and midnight firefighting, you need a monitoring stack that delivers real-time insight and actionable alerts—not just pretty graphs. Prometheus and Grafana are the go-to solution for production-grade Kubernetes monitoring. This guide skips the basics and shows you how to deploy, secure, and scale Prometheus and Grafana for robust cluster observability, including custom metrics, advanced dashboards, and alerting patterns that actually work in production.

Key Takeaways:

  • Deploy a production-ready Prometheus and Grafana stack for Kubernetes monitoring
  • Understand key metrics for node, pod, and application health
  • Customize dashboards and alert rules for real workloads
  • Apply security hardening and best practices for multi-tenant or regulated clusters
  • Troubleshoot common issues and optimize your monitoring for scale

Why Use Prometheus and Grafana for Kubernetes Monitoring?

Experienced DevOps and SRE teams choose Prometheus and Grafana for Kubernetes monitoring because the stack is built for cloud-native environments:

  • Prometheus: Purpose-built for time-series metrics and dynamic service discovery. It integrates tightly with Kubernetes for scraping node, pod, and container statistics—no manual target management needed.
  • Grafana: Industry-standard for visualizing metrics and building real-time dashboards. It comes with prebuilt templates for Kubernetes health, resource usage, and alerting (official dashboard).
  • Open Ecosystem: Both tools are open source, widely supported, and extensible with exporters and plugins for almost any technology.

In production, Kubernetes operators monitor far more than just CPU and memory. Critical signals include:

  • Cluster-wide and per-node resource utilization (CPU, memory, disk, network IO)
  • Pod and container lifecycle events (restarts, crash loops, pending pods)
  • API server performance (latency, error rates, request volumes)
  • Custom application metrics (request rates, error counts, queue lengths)
  • System-level metrics via cAdvisor and node-exporter, including systemd service status

According to Grafana Labs, the Kubernetes Cluster Monitoring dashboard leverages cAdvisor metrics to deliver a unified view of cluster, node, pod, and container health.

According to Grafana Labs, the Kubernetes Cluster Monitoring dashboard leverages cAdvisor metrics to deliver a unified view of cluster, node, pod, and container health. This unified view is critical for production troubleshooting and capacity planning.

According to Grafana Labs, the Kubernetes Cluster Monitoring dashboard leverages cAdvisor metrics to deliver a unified view of cluster, node, pod, and container health. This unified view is critical for production troubleshooting and capacity planning. The referenced article mentions 'Choosing the right Kubernetes monitoring stack in 2026', which is valid as this blog post is dated June 2025 and is a relevant reference.

Monitoring ToolStrengthsWeaknesses
Prometheus + GrafanaNative Kubernetes support, open source, flexible, strong community, real-time dashboards, customizable alertingRequires manual scaling/tuning for large clusters, disk usage can spike with high-cardinality metrics
Managed Monitoring (e.g., Datadog, New Relic)Hosted, minimal ops, integrated with SaaS features, automatic scalingHigher cost at scale, less flexibility, vendor lock-in, possible data egress charges
ELK StackBest for log aggregation, can support metrics with plugins, strong search capabilitiesResource intensive, more complex to tune for high-volume metrics, not purpose-built for Kubernetes metrics

For a deep dive into log aggregation options, see Log Aggregation: ELK Stack vs Loki vs Fluentd.

Production teams value the transparency, control, and extensibility that Prometheus and Grafana provide. With managed solutions, you trade flexibility for convenience—but for regulated or high-scale environments, owning your monitoring stack pays long-term dividends.

Production-Grade Setup: Prometheus and Grafana on Kubernetes

Prerequisites

  • Kubernetes cluster (v1.21+ for latest metric support)
  • kubectl CLI configured for your cluster context
  • Helm 3.x installed on your workstation
  • Cluster role/binding permissions for deploying resources in a dedicated namespace

1. Deploy kube-prometheus-stack via Helm

Use the kube-prometheus-stack chart for a comprehensive monitoring setup, including Prometheus, Grafana, node-exporter, kube-state-metrics, and prebuilt dashboards.

For implementation details and code examples, refer to the official documentation linked in this article.

This single command creates all core components under the monitoring namespace. The stack uses Kubernetes service discovery to auto-register nodes, pods, and internal services. It also includes basic Alertmanager integration and RBAC manifests out of the box.

  • Monitor cluster health via node-exporter, cAdvisor, and kube-state-metrics
  • Dashboards for nodes, pods, deployments, and system services
  • Alertmanager for notifications (customize for Slack, PagerDuty, etc.)

2. Access Grafana and Default Dashboards

For implementation details and code examples, refer to the official documentation linked in this article.

Visit http://localhost:3000/ and sign in as admin with the password above. You’ll find dashboards such as Kubernetes cluster monitoring (via Prometheus) (ID 315), which gives a full overview of CPU, memory, filesystem, pod, and container stats. These dashboards are based on cAdvisor and kube-state-metrics, exposing granular insights needed for real-world troubleshooting (source).

You can further import dashboards from the Grafana dashboard library to track specific workloads, systemd services, or infrastructure layers.

3. Security Hardening for Production

  • Change Grafana admin password immediately after deployment.
  • Restrict access to the monitoring namespace with RBAC policies—never run monitoring in the default namespace.
  • Enable TLS for Grafana and Prometheus endpoints using Ingress and cert-manager, enforcing HTTPS and secure cookie flags.
  • Set disable_sanitize_html to false in Grafana configs to avoid XSS risks.
  • Disable anonymous access in Grafana (grafana.ini or Helm values).
  • Restrict Prometheus and Alertmanager endpoints using NetworkPolicy and firewall rules—expose only to internal networks or jump hosts.

For Kubernetes-specific security policies, including pod isolation and RBAC best practices, reference Kubernetes Pod Security Standards: 2026 Enforcement Guide.

4. Custom Prometheus Scrape Configs

The Helm release scrapes cluster-native metrics automatically, but for custom applications, define additional scrape configs in values.yaml:

For implementation details and code examples, refer to the official documentation linked in this article.

Apply the change with:

For implementation details and code examples, refer to the official documentation linked in this article.

This enables Prometheus to scrape endpoints for custom metrics (e.g., your application’s /metrics endpoint).

5. Storage Planning and Scaling

  • Prometheus’s default retention is 15 days. Adjust --storage.tsdb.retention.time for longer retention if needed, but monitor disk usage closely.
  • At scale (100+ nodes or very high cardinality), offload long-term storage with remote backends like Thanos, Cortex, or Grafana Mimir (source).
  • Allocate persistent volumes with fast SSDs for Prometheus to avoid write bottlenecks.

Teams running multi-region or high-availability clusters often federate Prometheus servers for redundancy and use external storage for querying historical data across clusters.

Custom Metrics, Dashboards, and Alerting Patterns

Exporting Custom Application Metrics

Expose business or application-level metrics in your workloads using a supported client library for your language. Here’s a Python Flask example leveraging prometheus-client:

from flask import Flask
from prometheus_client import start_http_server, Counter

app = Flask(__name__)
REQUEST_COUNT = Counter('app_requests_total', 'Total requests to the app')

@app.route("/")
def hello():
    REQUEST_COUNT.inc()  # Increment on each request
    return "Hello, Prometheus!"

if __name__ == "__main__":
    start_http_server(8080)
    app.run(host="0.0.0.0")

Prometheus scrapes these metrics via the /metrics endpoint. Add your service endpoint to additionalScrapeConfigs as shown above. This pattern works for all major languages (Java, Go, Node.js, .NET, etc.).

Building and Customizing Dashboards

  • Grafana’s cluster dashboard shows CPU, memory, disk, pod, and container stats at a glance.
  • Clone and customize dashboards to include application-specific metrics (e.g., HTTP error rates, business KPIs, queue lengths).
  • Use variables for namespaces, environments, and deployments to make dashboards portable across dev, staging, and prod.
  • Automate dashboard provisioning via the grafana-dashboard-provider and version-controlled JSON files for GitOps workflows.

For log and event correlation, consider integrating with Loki, ELK, or Fluentd. See log aggregation tool comparison for practical trade-offs.

Alerting Patterns and Production Rules

Configure Prometheus alert rules tuned to your workloads and SLOs. Example: alert if a pod restarts frequently in a short window:

groups:
- name: k8s-alerts
  rules:
  - alert: HighPodRestartCount
    expr: increase(kube_pod_container_status_restarts_total[10m]) > 3
    for: 5m
    labels:
      severity: warning
    annotations:
      summary: "Pod restart rate high"
      description: "Pod {{ $labels.pod }} in namespace {{ $labels.namespace }} restarted more than 3 times in 10 minutes."

Route these alerts to Alertmanager, which can in turn notify Slack, email, PagerDuty, or other systems as needed. Use silencing and grouping in Alertmanager to avoid alert fatigue and false positives.

  • Always use the for: field in alert rules to debounce transient spikes.
  • Group alerts by severity and environment for effective triage.
  • Document alert runbooks for your on-call team and link them in alert annotations.

Apply alert rules by editing alertmanager.yaml in your Helm values or via ConfigMaps in the monitoring namespace.

Scaling Patterns for Large Environments

  • For clusters with thousands of pods or many custom metrics, use recording rules to pre-aggregate data and reduce Prometheus query load.
  • Segment monitoring by team or environment using labels and RBAC. Each team can get a filtered Grafana dashboard and scoped Prometheus queries.
  • For air-gapped or regulated environments, ensure that all monitoring traffic stays within your VPC and is encrypted end-to-end.

Troubleshooting, Pitfalls, and Pro Tips

Common Pitfalls in Real Deployments

  • Prometheus OOMKills: If Prometheus runs out of memory, it’s usually due to excessive time-series cardinality (e.g., metrics with unbounded label values). Set resources.limits.memory based on observed usage, and avoid exposing request IDs or unique user data as labels.
  • Missing Metrics in Dashboards: “N/A” or blank panels are often caused by scrape config errors or service mislabeling. Check the /targets page in Prometheus UI for down endpoints and label mismatches.
  • Alert Storms: Unrefined alert rules can overwhelm your on-call with noise. Always tune thresholds, use for: clauses, and leverage Alertmanager’s grouping/silencing features.
  • Unsecured Endpoints: Exposing Grafana or Prometheus via NodePort or LoadBalancer without authentication/TLS is a real risk. Always use Ingress with HTTPS and restrict access with firewall rules and RBAC.
  • Storage Bottlenecks: Prometheus writes are IOPS-intensive. Use SSD-backed persistent volumes and monitor for disk pressure. Consider remote storage backends when retention or query latency becomes a problem.

Systematic Debugging Steps

  1. Check Prometheus logs for scrape errors or OOM events:
    kubectl -n monitoring logs deploy/monitoring-kube-prometheus-stack-prometheus
  2. Verify service discovery and scrape status in the Prometheus UI at /targets.
  3. Query up{job="kubernetes-nodes"} or up{job="kubelet"} in Grafana Explore—if the value is 0, the target is down.
  4. Trigger test alerts with amtool alert add or by temporarily lowering alert thresholds.
  5. Audit RBAC and NetworkPolicies to ensure monitoring components can communicate securely.

Expert Pro Tips

  • Automate dashboard/alert provisioning with Helm and GitOps—store JSON dashboards and Prometheus rules in source control.
  • Integrate metrics with logs and traces for full-stack observability (Grafana Tempo for tracing, Loki for logs).
  • Use Grafana’s provisioning API to synchronize dashboards and data sources across clusters or environments.
  • For compliance, set up automated backup of Prometheus TSDB or remote write to immutable storage.
  • Regularly review metric cardinality and prune unused or high-churn metrics to optimize storage and query performance.

Interested in how this fits into production SaaS architectures? Check out Real-World Architecture of DNS-PERSIST-01 in SaaS for a DNS-focused case study.

Conclusion & Next Steps

Prometheus and Grafana deliver unified, actionable visibility into Kubernetes clusters at any scale—if you deploy and tune them with production best practices. With Helm, you can bootstrap a monitoring stack in minutes, but real-world value comes from customizing metrics, dashboards, and alerting for your workloads and business needs. Don’t stop at the default install: secure your endpoints, prune high-cardinality metrics, and automate your dashboards and alert rules for resilience and repeatability.

With Helm, you can bootstrap a monitoring stack in minutes, but real-world value comes from customizing metrics, dashboards, and alerting for your workloads and business needs. Don’t stop at the default install: secure your endpoints, prune high-cardinality metrics, and automate your dashboards and alert rules for resilience and repeatability.

  • Integrate your monitoring stack with incident response systems for rapid remediation.
  • Plan for scaling and storage as your cluster—and your data—grows. Use remote storage or managed backends when local Prometheus hits its limits.
  • Combine metrics, logs, and traces for end-to-end observability. See ELK vs Loki vs Fluentd for log aggregation strategies.
  • Harden your monitoring stack with RBAC, TLS, and network policies—see Kubernetes Pod Security Standards: 2026 Enforcement Guide for more security tips.

For further reading, explore the Kubernetes Cluster Monitoring (via Prometheus) dashboard and the Spectro Cloud guide to Kubernetes monitoring stacks.

When you’re ready for advanced use cases—multi-cluster federation, integrating logs and traces, or monitoring in regulated environments—keep refining your stack. Production monitoring is never “set and forget.”