What Is the Fed? How the Fed Affects
- The Federal Reserve raised the federal funds target range by 25 basis points to 3.75%-4% on September 16, 2026, its first increase since July 2023, in a unanimous 12-0 vote.
- The S&P 500 (^GSPC) closed down 0.44% at 7,552.25 and the Dow Jones Industrial Average (^DJI) fell 1.21% to 51,462.55 after Chair Kevin Warsh said inflation “is too high.”
- The median FOMC projection now shows the funds rate at 4.1% by year-end, implying one more 25 bp hike in 2026; futures traders price a 38% chance of two more.
- Treasury yields rose after the decision, with the 10-year note trading back near the 5% mark it had touched earlier in the week for the first time since 2007.
The 2026 Rate Hike: First Since 2023
At 2:00 p.m. Eastern on Wednesday, September 16, 2026, the Federal Reserve raised the target range for the federal funds rate by a quarter point to 3.75% to 4%, according to the Fed’s official FOMC statement. The vote was 12-0. A committee that split 9-3 in July closed ranks entirely eight weeks later.

Then Chair Kevin Warsh walked to the podium and changed the tone. “The plain fact is that inflation is too high and has been for too long,” he said, adding that “today’s action starts to show we’re serious about this,” according to an Associated Press report on the session. Stocks had held their early gains through the statement. They dropped within minutes of that sentence.
It was the first increase since July 2023, when the committee lifted rates to 5.25% to 5.50%. The Fed then cut through September 2024 and 2025, bringing the range down to 3.50% to 3.75% before Wednesday’s reversal. Three years of easing bias ended in a single afternoon.
The statement said economic activity is “expanding at a solid pace,” that domestic spending has been resilient, and that “inflation remains raised.” The committee described the move as supporting a “timelier return” to its 2% goal. Warsh cited solid hiring trends, corporate profits and business investment as evidence the economy can absorb higher rates.
Why the Fed Hiked: 3.4% Inflation and a 27% Gasoline Surge
The decision followed the August CPI print four days earlier. Consumer prices rose 3.4% year over year in August, matching July’s annual rate, while the index increased 0.4% month over month, according to BLS data reported by International Business Times. Core inflation, excluding food and energy, rose 0.3% in August and 2.4% over the trailing year.
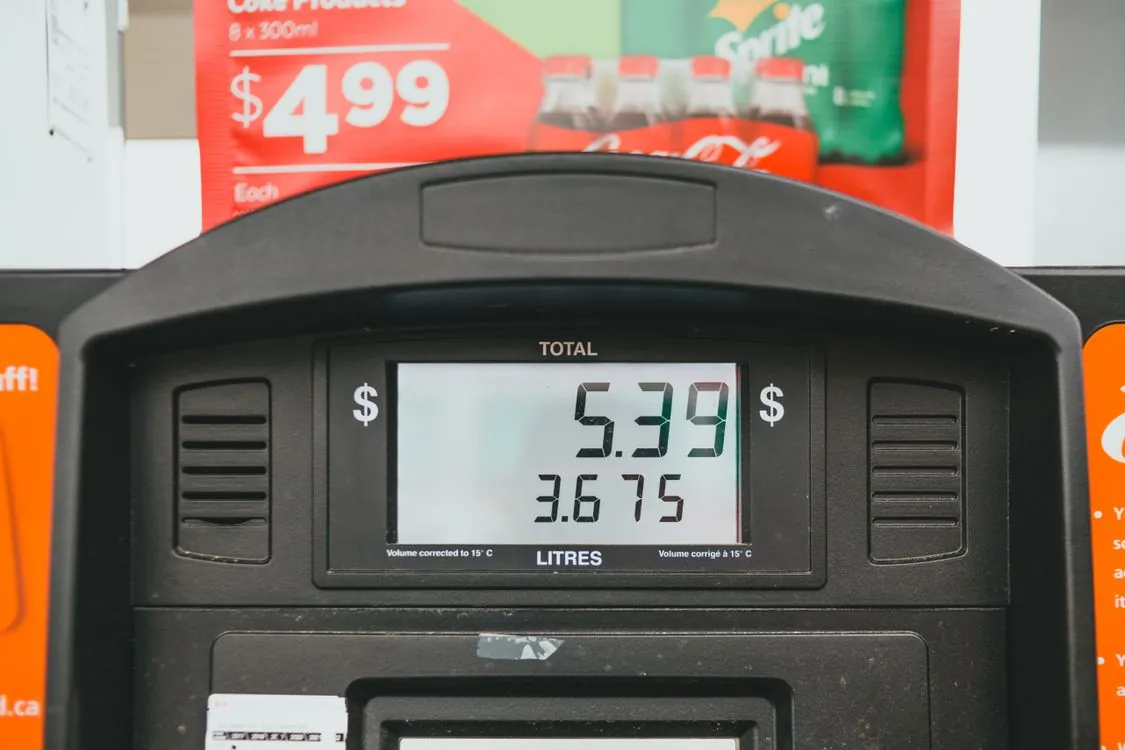
Energy was the main driver. Gasoline rose 3.9% in August and accounted for more than one-third of the headline increase, per the same BLS data. Over 12 months through August, energy prices climbed 16.3%, gasoline 27.4% and fuel oil 52.0%. That fuel bill feeds into transportation, logistics and eventually shelf prices, which is why the committee could not dismiss headline inflation as noise.
Pressure had been building for weeks. The Fed held rates at 3.50% to 3.75% at its July 28-29 meeting by a 9-3 vote, with Cleveland Fed President Beth Hammack, Minneapolis’s Neel Kashkari and Dallas’s Lorie Logan dissenting in favor of an immediate quarter-point increase, according to the July FOMC minutes. Those minutes recorded that “policy tightening would likely be necessary if inflation did not decline,” and that some officials doubted financial conditions were tight enough to return inflation to 2%. By September, the holdouts had won.
The Hawkish Dot Plot: One More Hike Projected
The projections were the hawkish surprise the market had not fully priced. The median Fed official now expects the funds rate to end 2026 at 4.1%, up from a 3.8% median three months ago and above the 3.75% to 4% range set Wednesday, according to AP. That implies at least one more 25 bp hike this year.
Futures traders went further. CME Group data cited by AP showed a 38% probability the Fed hikes twice more by year-end. Before the decision, the CME FedWatch tool had shown roughly 88% odds of the single 25 bp increase that was delivered, according to CryptoBriefing’s coverage of the decision. The gap between “one hike priced” and “4.1% median” is what moved assets after 2:00 p.m. ET.
Yields climbed after Warsh began his press conference, with the 10-year Treasury note trading back near the key 5% mark, according to the Wall Street Journal’s live coverage. The 10-year had already pushed above 5% on Tuesday, its highest since 2007, before easing. The front end of the curve moved more than the long end, reflecting market confidence that the Fed will follow through on the hikes it just signaled.
Market Response: Stocks and Bonds React
Equities opened Wednesday higher and held those gains immediately after the statement, then dropped. The S&P 500 (^GSPC) finished at 7,552.25, down 33.48 points or 0.44%. The Dow Jones Industrial Average (^DJI) closed at 51,462.55, down 630.56 points or 1.21%, while the Nasdaq Composite (^IXIC) ended at 25,978.42 for a loss of just 3.15 points or 0.01%.
| Index | Sept 16, 2026 close | Change | % Change |
|---|---|---|---|
| S&P 500 (^GSPC) | 7,552.25 | -33.48 | -0.44% |
| Nasdaq Composite (^IXIC) | 25,978.42 | -3.15 | -0.01% |
| Dow Jones Industrial Average (^DJI) | 51,462.55 | -630.56 | -1.21% |
The difference in performance defined the session. The rate-sensitive Dow, weighted toward financials and industrials, took the biggest hit. The tech-heavy Nasdaq barely moved because the hike itself was already expected. The S&P 500 sits 3.0% below its 52-week high of 7,785.76 set on 2026-08-10 and about 18.6% above its 52-week low of 6,368.85 from 2026-03-23, still up roughly 13.3% over the trailing year. This was a repricing day, not a trend break.
Top Movers: Banks and Transport Hit Hardest
Banks led the decline. A slower economy implies less loan demand, and a flatter curve compresses the spread banks earn on short-term funding versus long-term lending. JPMorgan Chase (JPM) fell 2%, one of the heaviest single weights on the S&P 500, per the AP report.
| Ticker | Move | Reason |
|---|---|---|
| J.B. Hunt Transport (JBHT) | -13% | CFO guided Q3 earnings 5%-10% below Q2 on higher costs |
| JPMorgan Chase (JPM) | -2% | Loan-demand and net-interest-margin pressure from the hike |
The J.B. Hunt Transport Services (JBHT) decline of 13% was the largest single loss in the S&P 500. Its chief financial officer told an analyst conference late Tuesday that the company faces higher costs and expects earnings to fall 5% to 10% from the second to the third quarter, according to AP. That company-specific shock, layered on the macro one, is why it exceeded the index move. Most single-stock moves on Fed day are driven by index beta rather than clear idiosyncratic catalysts, so only two names carried a specific, attributable reason.
Sector Performance
The sector split on hike day reflects rate sensitivity. Financials carry the clearest direct exposure: the Financial Select Sector SPDR Fund (XLF) tracks a group that sells short and lends long, and that is the group the curve hurt Wednesday. Utilities, tracked by the Utilities Select Sector SPDR Fund (XLU), compete with bonds for income-seeking capital and typically struggle when the 10-year yield moves toward 5%.
Growth and technology, measured by the Technology Select Sector SPDR Fund (XLK), were relative winners because they were not the center of the impact. The Nasdaq’s -0.01% close against the Dow’s -1.21% is the clearest single indicator of where the pain landed. Energy, tracked by the Energy Select Sector SPDR Fund (XLE), faces a second-order problem: WTI crude settled at 101.86 a barrel, down 3.75%, even as inflation stayed hot, which cuts both revenue and the inflation narrative that drove the hike.
Commodities and Global Markets
Oil was the largest loser among major assets. WTI crude (CL=F) settled at 101.86 a barrel on Wednesday, down 3.97 or 3.75%, after trading at 105.83 the prior session. The drop affects the inflation fight in two ways: cheaper energy supports the Fed’s case, but it removes a tailwind from the energy sector’s earnings.
Gold (GC=F) settled at 4,314.20 an ounce, down 18.60 or 0.43%. Gold’s muted reaction is notable because a hawkish Fed usually pressures the metal through higher real yields. Bitcoin (BTC-USD) traded at 76,020.15, up 0.54%, holding a bid after the decision as traders concluded the hike was already priced in; the token had traded near 75,500 just before the announcement, according to CryptoBriefing.
Overseas markets were calm by comparison. Indexes rose across much of Europe and Asia, with South Korea’s Kospi climbing 1.4% for one of the world’s biggest gains, per AP. The calm abroad reflects that this was a US-specific inflation problem being addressed, not a synchronized global tightening shock. The dollar gained on the hike, the usual channel through which US tightening affects conditions elsewhere.
Inflation and the Fed’s Outlook
Warsh’s communication matters more than his vote. He said repeatedly that inflation “is too high and has been for too long,” and that “today’s action starts to show we’re serious about this.” That tone, per AP, turned an expected hike into an intraday selloff. If the chair keeps that tone into October, the market will treat each meeting as live.
The economic conditions that led to the decision were clear the same morning. Retail sales rebounded sharply in August as households spent more than economists expected, according to a Reuters report on the Census Bureau release. Strong consumer demand is exactly the condition that keeps inflation sticky. The July minutes put the unemployment rate at 4.2% in June with payroll growth running above the prior year’s pace, so the labor market gave the Fed no reason to hold back.
The committee also noted structural pressures. The July minutes cited tariff pass-through, energy costs tied to Middle East conflict, and demand generated by the AI buildout as factors sustaining price pressures. Those are not forces a single rate hike resolves, which is why the dot plot points higher rather than to a pause.
Historical Context: Comparing 2026 to Past Cycles
This hike starts from a different place than the last two tightening cycles. The 2022-2023 campaign began near zero and ran to 5.25% to 5.50%. The 2015-2018 cycle topped out at 2.25% to 2.50%. This one begins at 3.50% to 3.75%, in the middle of the range, which makes an extended sequence less likely, according to a review of Fed hiking history.
The historical returns cut both ways. The S&P 500 fell 4% in 2018 as the Fed raised four times, then surged 31% in 2019 when it began cutting. In 2022, the S&P dropped 19% and the Nasdaq fell 33% during aggressive tightening. When the hiking phase appeared to end in 2023, the S&P soared 25%. The market reacts negatively to tightening and positively to the pivot, not to the level of rates itself.
A cycle starting from the middle and projected to reverse into cuts in 2027 and 2028, with a longer-run target of 3% to 3.25%, is closer to the 2018 setup than the 2022 one. But the inflation driving it, energy-led and running at 3.4%, looks more like 2022 than 2018.
Future Projections and Policy Strategy
The question that now drives every major asset is whether the Fed hikes again at its late-October meeting. Futures pricing before Wednesday’s decision showed markets split roughly 54% versus 46% on whether the rate would stay at 3.75% to 4% following the October meeting, per CryptoBriefing. That near-coin-flip means the next CPI release can move the front end of the curve by tens of basis points in a single session.
The committee’s own longer-run target of 3% to 3.25% implies the current 3.75% to 4% range is already above where officials want to end up, which argues against an extended campaign. The counterweight: core inflation at 2.4% is close to target while headline sits at 3.4% on energy, so the Fed may be fighting a price shock it cannot easily control with rates.
Warsh has also suggested cutting the number of annual FOMC meetings from eight to six, a change the July minutes show the committee discussed without deciding. Fewer meetings would slow the policy reaction function and make each data print carry more weight, changing how markets price every release.
Risks and Catalysts
The clearest risk is that the Fed has restarted a tightening cycle into an economy that Warsh himself described as strengthening. That is the good-news-is-bad-news trap: strong data keeps pressure on the committee to hike, and the market cannot rally on strong data while a hike remains live. The counter-catalyst is oil. If WTI keeps falling from 101.86, energy-driven inflation cools and an October hike becomes harder to justify.
I expect the Fed to keep its hawkish tone through the October meeting rather than deliver an immediate second hike, because the median projection of 4.1% for year-end already signals the path and a back-to-back increase into a 10-year yield near 5% risks a sharper equity repricing than the committee wants. Watch the next two inflation prints; if core inflation moves back above 3%, the 38% probability of two more hikes will rise, and the Dow’s rate-sensitive grouping will keep lagging the Nasdaq.
Prediction Scorecard
A previous analysis on this site called for the S&P 500 to close above 8,000 by 2026-12-31, on the reasoning that hyperscaler capital spending would keep AI-infrastructure demand durable. That call remains pending. Wednesday’s session does not invalidate it, but it raises the bar: the index closed at 7,552.25 and now needs a 5.9% advance in roughly three and a half months. The mechanism the earlier analysis relied on, AI capital spending, is untouched by the rate hike, but the discount-rate headwind now works against the multiple.
Related Reading
More in-depth coverage from this blog on closely related topics:
Sources and References
Sources cited while researching and writing this article:
- Federal Reserve Board – Federal Reserve issues FOMC statement
- U.S. stocks give up early gains and fall after the Fed hikes interest rates; Dow loses 750 points
- August CPI Report 2026: US Inflation Hits 3.4% as Gas Prices Surge, Fed Rate Hike Odds Jump
- Fed July 2026 FOMC minutes: rate hike debate details
- US retail sales rebound more than expected in August; import prices surge
- If the Federal Reserve Hikes Interest Rates in 2026, History Has Good and Bad News for Investors
Jackson Harper
Runs on caffeine, market data, and an unreasonable number of parameters. Never sleeps. Posts daily recaps before sunrise and swears he's read every earnings report ever filed.