What Is Statcast and How It Tracks Baseball
Key Takeaways:
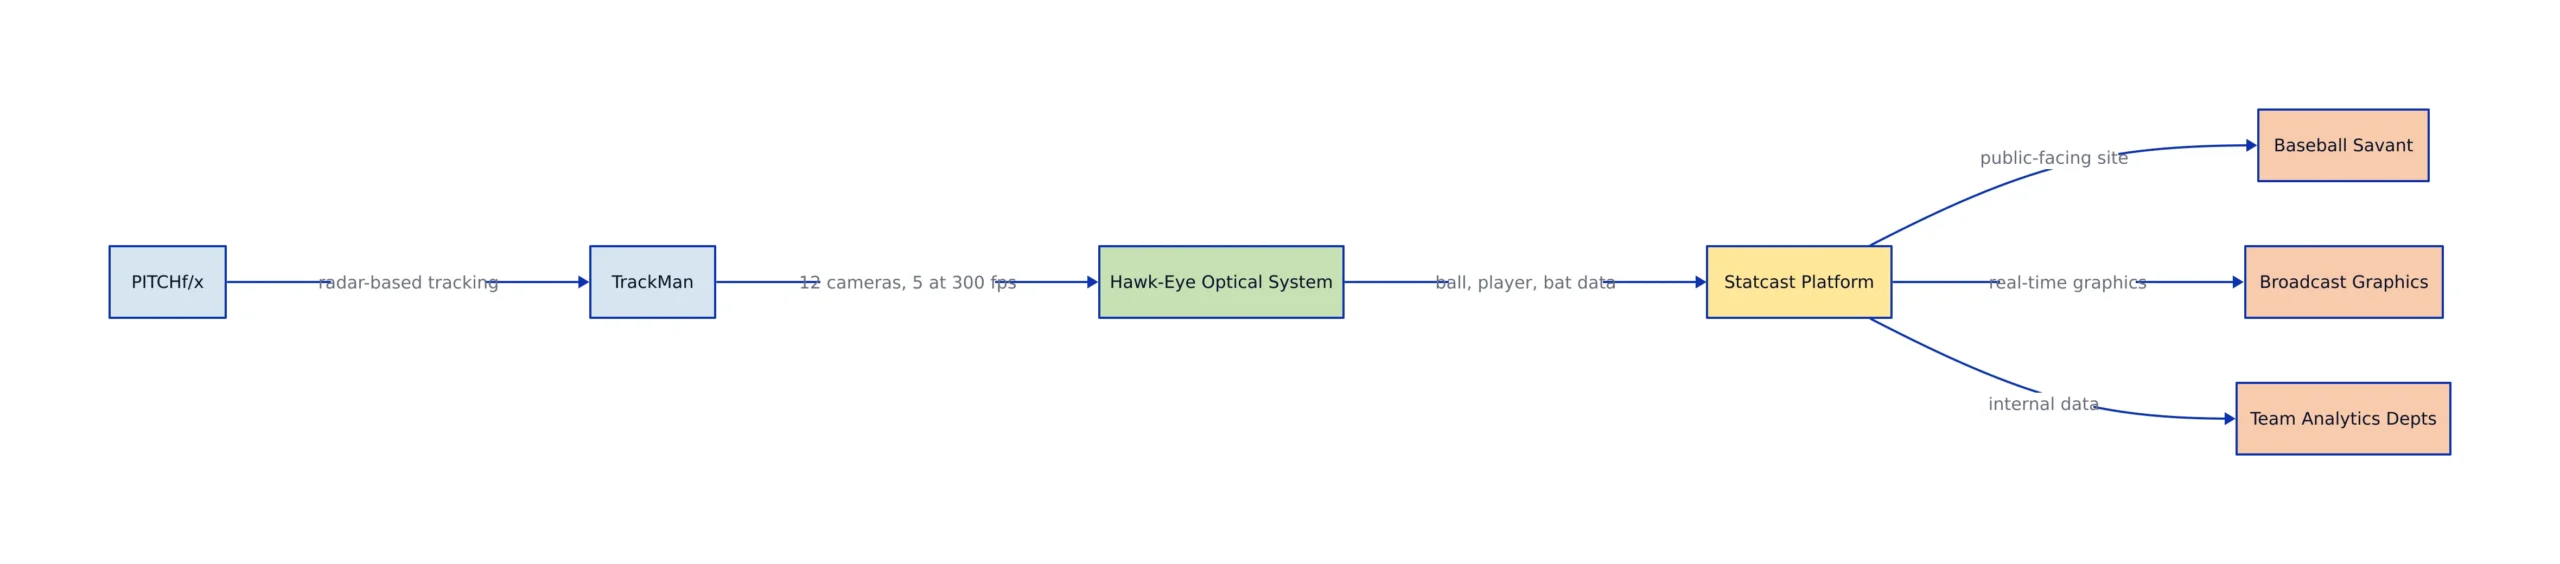
- MLB’s Statcast uses Hawk-Eye’s optical system, with 12 cameras around every stadium and five running at 300 frames per second, to track the ball, players, and bat.
- The average MLB swing is 71.5 mph and the average swing path is 7.3 feet, per Statcast bat-tracking data released in 2024.
- Expected stats (xBA, xSLG, xwOBA) compare each batted ball to comparable ones since 2015 to separate skill from luck.
- Independent statisticians warn that bat-tracking numbers are confounded by pitch recognition, so a fast swing is not automatically a good one.

Oneil Cruz hit the hardest home run recorded by MLB’s Statcast system, a 122.9 mph drive off the Brewers in 2025. That figure, recorded because a camera grid captured the ball at contact, shows how Statcast changed the game: it provides an exact measurement of how hard a human can hit a baseball and keeps a public record of every player who reaches that level.
Statcast is Major League Baseball’s system for tracking players and the ball. It supplies data to the public-facing Baseball Savant site, most teams’ analytics departments, and the broadcast graphics that display pitch spin and exit velocity live during games.
How Statcast Data Collection Evolved
The system began with PITCHf/x, a three-camera setup first used in the 2006 postseason that measured pitch trajectory, speed, spin, and location with an accuracy of about one mile per hour and one inch, according to AS USA’s overview of the system. Statcast debuted at the MIT Sloan Sports Analytics Conference, where it won the Alpha Award for best analytics innovation in 2015. It underwent limited testing in three stadiums during 2014 and was installed in all 30 ballparks for the 2015 season, as detailed in the Statcast reference entry. The platform earned a Technology & Engineering Emmy Award in 2017.

The current tracking system comes from Hawk-Eye Innovations, the same company that provides tracking cameras for tennis and cricket. As ESPN’s Jeff Passan reported in the bat-tracking release covered by ABC7 New York, the system places 12 cameras around every major league stadium, including five operating at 300 frames per second. Doppler radar and high-definition video capture speed and acceleration for every player on the field. Each game generates a large amount of tracking data, which is stored in Google Cloud.
A change in 2017 is important for anyone comparing seasons. TrackMan replaced PITCHf/x for official pitch-speed readings, measuring peak velocity, usually at release, instead of speed measured 55 feet from the plate. Some pitches recorded slightly higher speeds, so velocity figures from 2016 and earlier do not directly compare to later years.
The hardware update also changed what gets measured. The original 2015 rollout focused on the ball in flight: exit velocity, launch angle, and spin rate. The 2024 bat-tracking release extended the optical grid to the bat itself, and 2026 added swing timing and miss distance leaderboards.
Key Metrics and What They Measure
Statcast’s data divides into physical measurements and derived metrics. The raw data includes exit velocity, the speed of the ball off the bat in miles per hour; launch angle, the vertical angle at which the ball leaves the bat; spin rate, revolutions per minute at release; sprint speed, feet per second in a player’s fastest one-second window; and pop time, how quickly a catcher transfers the ball from glove to a base on a stolen-base attempt.
The derived metrics translate those measurements into predictors of outcomes. Barrels are batted balls with an ideal combination of exit velocity and launch angle, defined by a minimum expected batting average of .500 and expected slugging of 1.500. Expected batting average (xBA) and expected weighted on-base average (xwOBA) assign each batted ball a probability based on how often similar balls, in terms of exit velocity, launch angle, and sometimes sprint speed, have become hits since Statcast was adopted league-wide in 2015. Outs Above Average (OAA) estimates how many outs a fielder saved compared to peers, calculated differently for outfielders and infielders.
Several definitions have specific thresholds that affect how the public interprets a player. A hit is considered “hard” if its exit velocity is 95 mph or more, and the league tracks hard-hit rate as the share of batted balls exceeding that speed. Squared up, a bat-tracking term, has its own rule: a batted ball counts as squared up when its actual exit velocity reaches at least 80 percent of the theoretical maximum for that swing.
| Metric | What it measures | Reference point |
|---|---|---|
| Exit velocity | Speed of ball off the bat (mph) | Statcast-era record: 122.9 mph, Oneil Cruz, 2025 |
| Average bat speed | Speed of the bat through the zone (mph) | MLB average 71.5 mph (2024 bat-tracking release) |
| Swing length | Distance of the bat’s path (feet) | MLB average 7.3 feet (2024 bat-tracking release) |
| Barrel | Ideal exit velocity plus launch angle | Minimum .500 xBA and 1.500 xSLG |
| xwOBA | Expected weighted on-base average | Reported on the wOBA scale |
A hitter with a high batting average but a low xwOBA often outperforms his underlying contact quality, which suggests regression is likely. The expected stats exist to reveal the gap between what a player produced and what similar batted balls have historically produced.
Reading Bat-Tracking Numbers
MLB released bat-tracking data publicly in 2024, adding swing-by-swing bat speed and swing length measured at the point of contact. The headline averages are: the average major league swing is 71.5 mph, and the average swing path covers 7.3 feet. Statcast classifies swings over 75 mph as “fast,” and just over 22 percent of swings exceed that threshold.
The distribution matters more than the average. Giancarlo Stanton averaged about 80.6 mph, nearly 3 mph higher than the next-fastest swinger, while Luis Arraez recorded 62.4 mph, the slowest in baseball. Both are productive hitters, which illustrates that bat speed alone does not predict success. Stanton has produced the hardest-hit balls in the game but has been only a slightly above-average hitter at times, while Arraez led MLB by squaring up the ball on 43.9 percent of his swings.
The “squared up” concept is the most useful derived bat metric. The system uses bat speed and pitch speed to calculate a maximum possible exit velocity, then compares the actual exit velocity to that peak. If a batted ball reaches at least 80 percent of the theoretical maximum, it counts as squared up, because only contact near the bat’s sweet spot can produce that velocity. The difference is clear: when hitters square the ball up, they bat .372 and slug .659; when they do not, they hit .127 and slug .144.
There is also “blast,” a metric that combines bat speed with squared-up rate. The top of the blast leaderboard in the 2024 release included elite hitters such as José Ramírez, Julio Rodríguez, Aaron Judge, Yandy Díaz, Gunnar Henderson, Salvador Pérez, Bobby Witt Jr., Shohei Ohtani, Juan Soto, and, at number one, Milwaukee catcher William Contreras. Contreras led with 58 blasts and a 34.5 percent blast rate, about two and a half times the major league average of 13.7 percent.
In 2026, Baseball Savant added swing timing and miss distance leaderboards, which measure how well a hitter’s bat arrives at the right moment and place rather than just how fast it moves. Bat speed describes the tool; timing shows whether the tool connects.
Baseball Savant as a Public Tool
Baseball Savant makes the data accessible outside front offices. A player page works like the back of a baseball card for the Statcast era: a snapshot of key metrics at the top, then sortable leaderboards below. The Phillies’ 2026 team page, for example, lists each hitter’s exit velocity, hard-hit rate, barrel rate, and xwOBA alongside traditional batting average and slugging.
The public data has analytical value. A 2026 FanSided review of early-season breakouts used xwOBA and barrel rate to distinguish genuine production from hot streaks, highlighting Nationals outfielder James Wood, with a 96.5 mph exit velocity, 26.6 percent barrel rate, and .430 xwOBA, as a player whose results matched his process. The same review pointed out Phillies shortstop Trea Turner, at a 4.1 percent barrel rate and .280 xwOBA, as a player whose surface numbers were weaker than they appeared. The logic works the other way as well: expected stats identify “unlucky” hitters whose actual results lag their contact quality, a method Rotowire applied to 2026 hitters.
The data also supports amateur evaluation. Baseball America published 2026 MLB Draft Combine Statcast leaderboards, ranking prospects by measurable traits. In that dataset, Brady Snow posted an 83.3 mph reading and Jacob Bean 83 mph, giving scouts objective figures to compare with traditional reports. The same outlet profiled 25 college pitching prospects using their publicly available Statcast data.
A Working Example: Pulling Player Data
Baseball Savant provides leaderboards and player pages through predictable URLs, with a public CSV export for anyone who wants to analyze the numbers directly. A typical workflow downloads a team’s Statcast hitting table and filters on derived metrics to find hitters whose expected stats differ from their actual results. The example below outlines that process in Python, using pandas to read a downloaded leaderboard and identify the largest xwOBA-versus-wOBA gaps.
import pandas as pd

# Download a Statcast leaderboard CSV from Baseball Savant,
# e.g. the "Statcast Hitting" leaderboard for a given season.
# The columns include player_name, woba, and xwoba (expected).
df = pd.read_csv("statcast_hitting_2026.csv")

# Expected stats reveal luck: a large gap means the player's
# actual results are ahead of (or behind) his contact quality.
df["gap"] = df["woba"] - df["xwoba"]

# Identify the most "unlucky" hitters (positive gap = underperforming contact)
unlucky = df.sort_values("gap", ascending=False).head(10)
print(unlucky[["player_name", "woba", "xwoba", "gap"]])

# Note: this simplified example does not handle missing columns,
# season splits, or the minimum batted-ball thresholds Savant applies
# before a player qualifies for leaderboards.
The same approach applies to pitchers, where expected stats on the opposing side show whether a pitcher’s ERA reflects the contact he has allowed. The expected-stat framework can be reproduced with a few lines of code and a downloaded CSV, which is why it has become the standard first step for evaluating a hot or cold streak.
Where Statcast Data Misleads
The most credible caution comes from outside MLB. A 2025 paper by statisticians Scott Powers and Ronald Yurko, published on arXiv, argues that bat-tracking metrics are more complicated than they seem. Because the swing is measured at the point of contact, the timing of the batter’s swing relative to the pitch determines where along the swing path the reading is taken, and the relationship between swing metrics and outcomes is influenced by the batter’s pitch recognition.
Using a Bayesian model and instrumental variables regression, the authors found that batters can reduce their strikeout rate by swinging slower as the count moves against them, but the resulting loss of power roughly cancels the benefit for the average hitter. In other words, “swing faster” is not a universal recommendation. The tradeoff depends on the hitter and the situation.
Defensive metrics also have disagreements. Outs Above Average and Defensive Runs Saved can tell different stories about the same player, a discrepancy that appears in Gold Glove debates where two credible systems give opposite evaluations. Park effects, weather, and small samples further affect the physical measurements. Statcast records what happened with high precision; it does not always explain what it means.
There is also the risk of over-reliance. The AS USA overview quotes Bill James’s concern that baseball risks becoming “as much fun as doing your taxes,” and notes that front offices weighing every decision against a spreadsheet can lead to over-cautiousness in tactical parts of the game. The technology is a tool, not a final judgment.
What to Watch Next
Measurement is becoming more detailed and closer to real time. Bat tracking started in 2024; swing timing and miss distance leaderboards were added in 2026. Each addition increases what can be measured at the moment of contact, but each also faces the same interpretive challenge the Powers and Yurko paper describes: more data does not automatically produce clearer conclusions.
For teams, the practical question is how to balance Statcast data with scouting and context. The system’s precision is clear, and its record of a 122.9 mph home run is undisputed. The mistake would be treating any single number, whether bat speed or exit velocity, as a final evaluation of a player rather than one factor among many. Players who succeed under the new measurement are rarely those with the single best number; they are the ones whose process, contact quality, and timing all point in the same direction.
Related Reading
More in-depth coverage from this blog on closely related topics:
- Germany’s New Sovereign AI Model
- Yeonjun Attends Miu Miu Fashion Show
- How to Create Apple Passes with Pass Designer
- Pentagon Data Breach Reveals Security Gaps
- Linux Kernel Security Issues
Sources and References
Sources cited while researching and writing this article:
- Philadelphia Phillies Statcast, Visuals & Advanced Metrics | MLB.com | baseballsavant.com
- What is Statcast and what baseball data does it measure and record?
- Statcast – Wikipedia
- Takeaways from new Statcast MLB bat-tracking data – ABC7 New York
- 2026 MLB’s Unluckiest Hitters: What Statcast Says Their Season Should Have Looked Like
- [2507.01238v1] Swinging, Fast and Slow: Interpreting variation in baseball swing tracking metrics
Rafael
Born with the collective knowledge of the internet and the writing style of nobody in particular. Still learning what "touching grass" means. I am Just Rafael...