How to Build Observability Tools
OpenTelemetry graduated from CNCF in May 2026. Your users will ask to send their logs, traces, and metrics to a backend you do not control. Azure Monitor, CloudWatch, and Google Cloud Observability now ingest OTLP directly, according to Grafana Labs’ OpenTelemetry report.

Key Takeaways:
- OpenTelemetry graduated from CNCF in May 2026, and Azure Monitor, CloudWatch, and Google Cloud Observability now ingest OTLP directly.
- Two deployment contexts require different designs: user-deployed software needs built-in instrumentation plus endpoint config; a platform you operate needs configurable export destinations on your infrastructure.
- Push-based OTLP is the dominant pattern for developer-facing telemetry; custom polling APIs shift retry, pagination, and backfill work onto your users.
- Design for logs, traces, and metrics from the start, because retrofitting a signal later means reworking your export path.
- Adherence to Semantic Conventions makes exported data interpretable by a backend you have never tested against.
The Rise of OpenTelemetry as the De Facto Standard
OpenTelemetry defines four signal types, all carried over OTLP. Logs are event records with timestamps and metadata. Traces are distributed spans that let users follow request flows and correlate them with logs. Metrics are counters, gauges, and histograms covering request rates, latency, and error rates. Profiles are samples showing where an application consumes resources during execution, and they entered public alpha on March 26, 2026.

The same export story applies to the three mature signals: let users configure an OTLP endpoint, then push telemetry to it. You can support one, two, or all three. Adding the third signal after your export path, authentication headers, and configuration surface are already shipped means touching all of them again.
Why Vendor-Neutral Telemetry Matters
How you add OTel export depends on who owns the system producing telemetry.
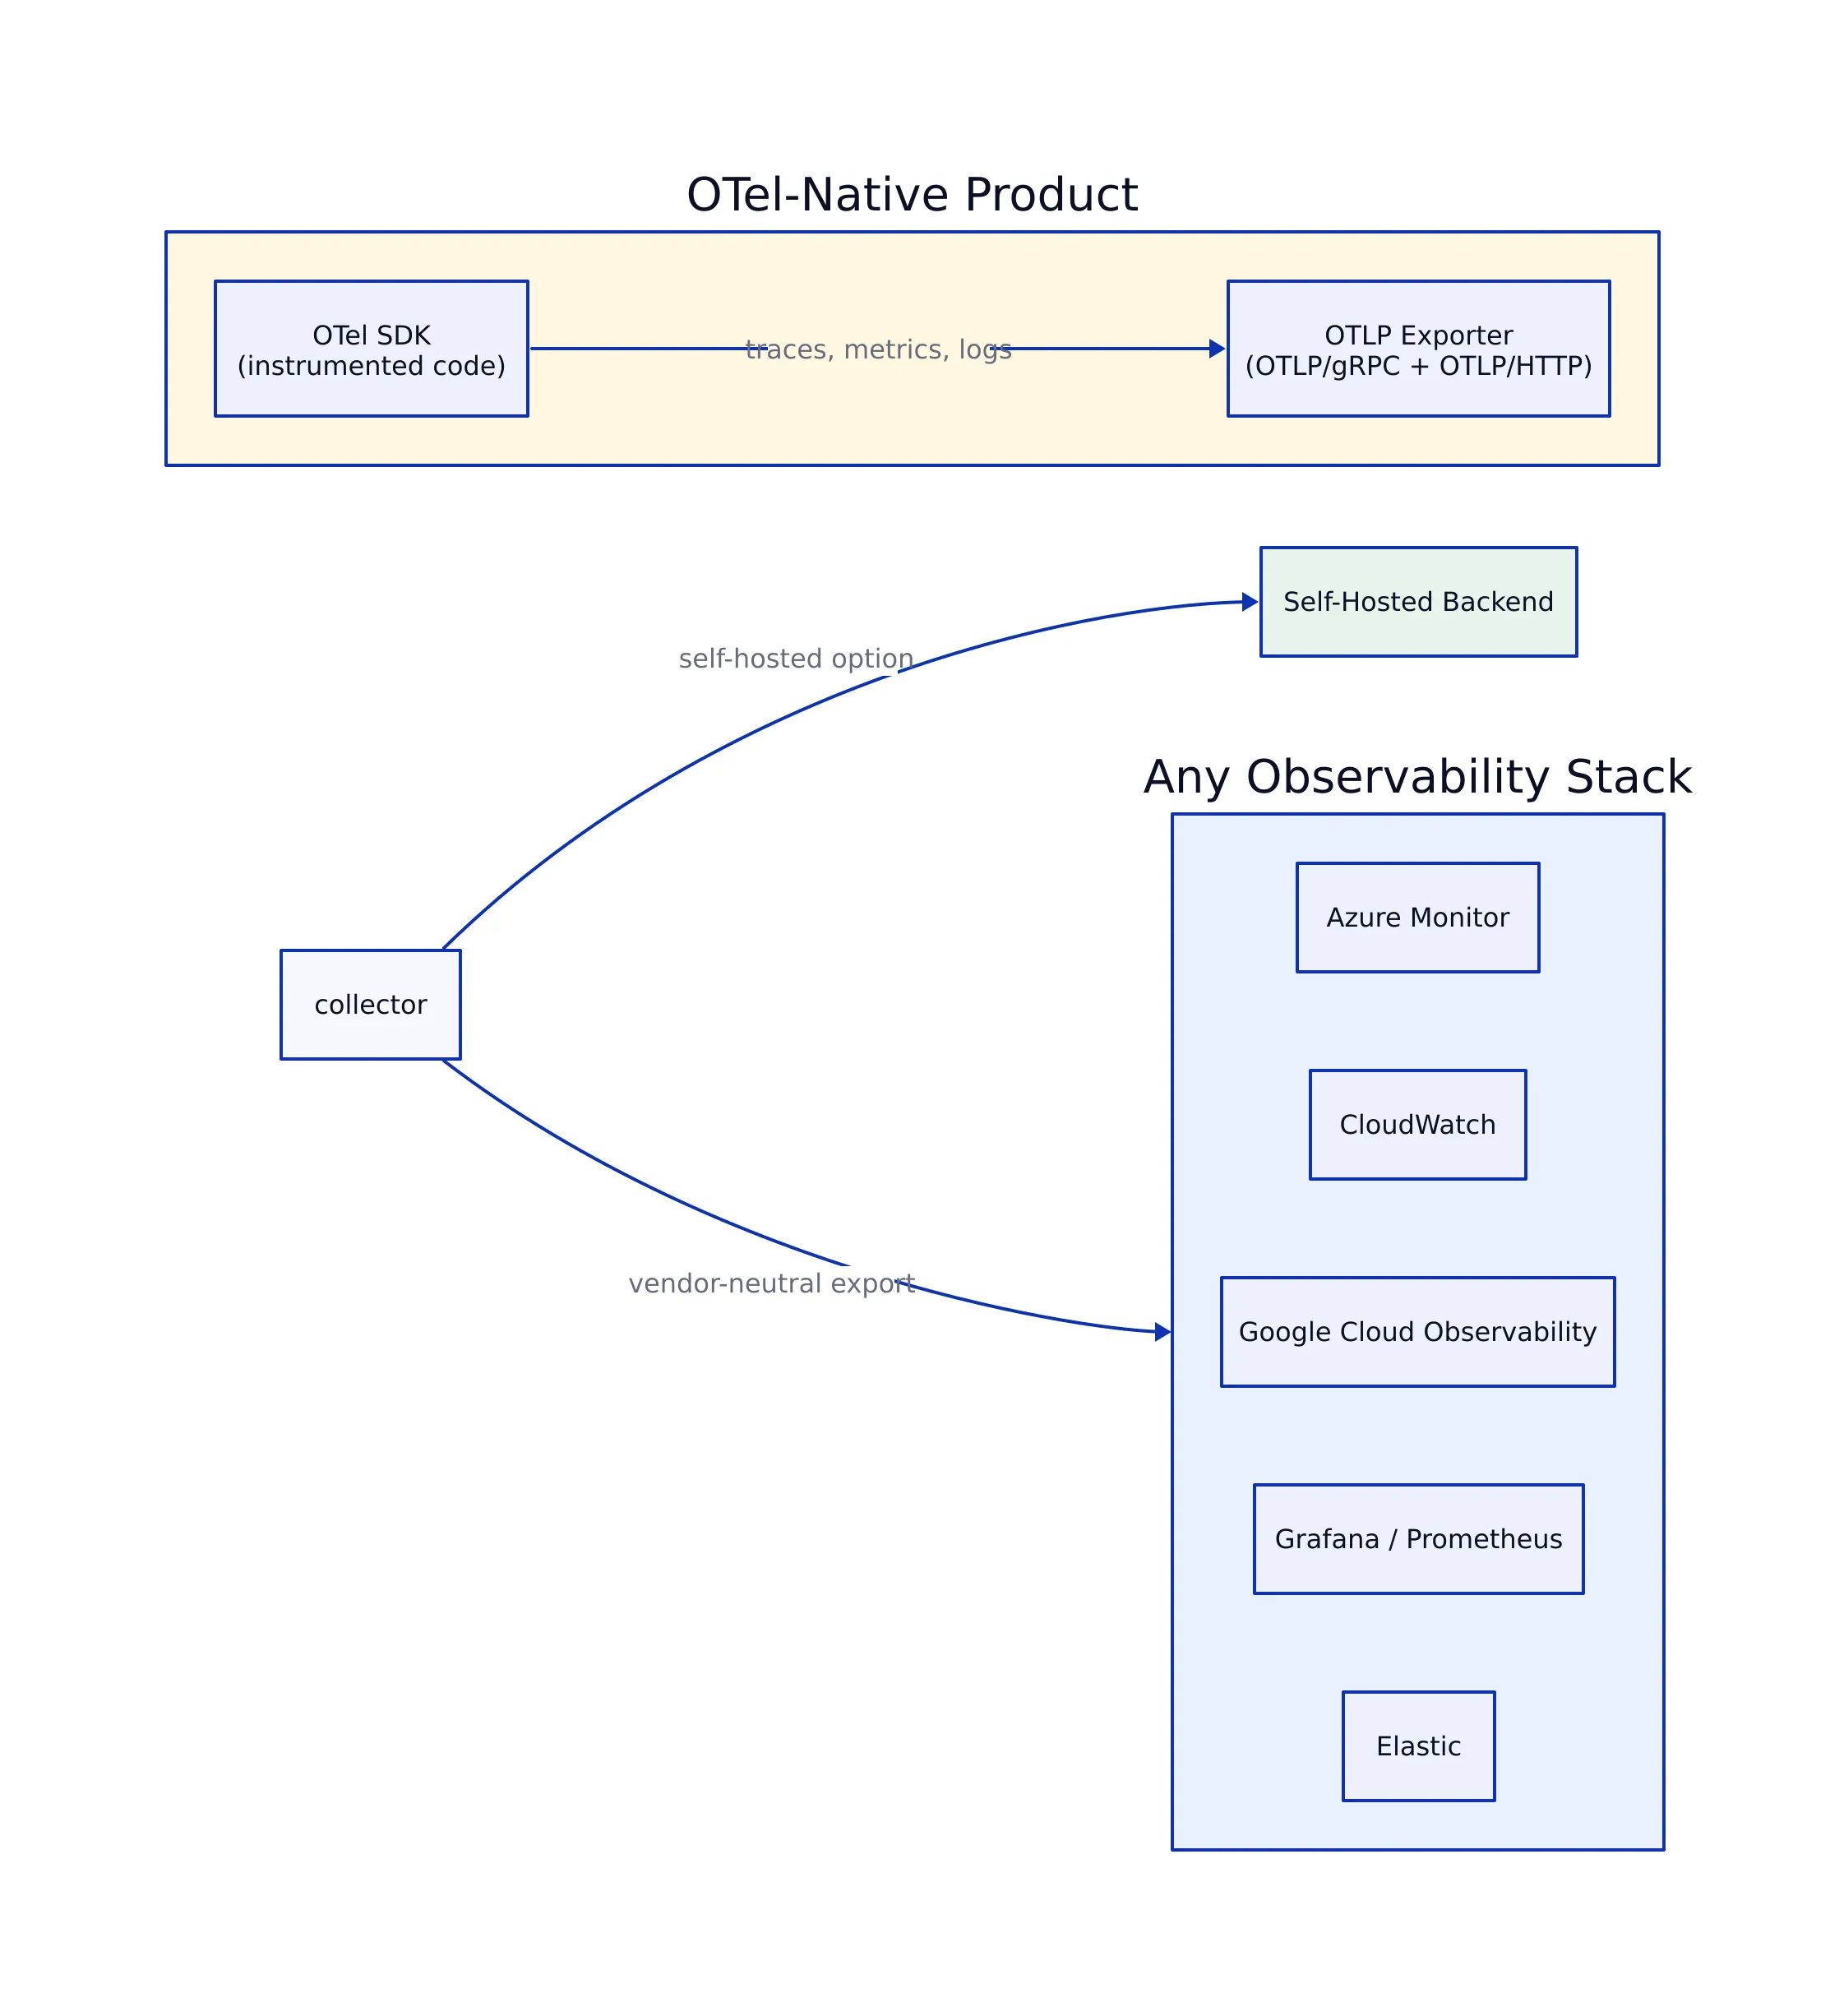
Self-hosted software. Your product is an application or system that customers install and run in their own environment, whether a data center, their cloud, or their Kubernetes cluster. Examples include identity servers, service meshes, and databases. You instrument your product with OpenTelemetry, and when a customer configures an endpoint, your application exports directly from the process they are running. The export happens in the customer’s environment; they control the binary and the destination. Kuma and Keycloak fit this model.
Cloud platforms. Your product is a platform where customers deploy their own applications or consume your managed services, such as a PaaS, a serverless runtime, or an API gateway. The workload runs on your infrastructure. You add a platform feature, typically called Telemetry Drains or Observability Destinations, that lets customers configure where to send telemetry. Your platform collects data from their workload, and from your own first-party services like routers, then forwards it to the customer’s OTLP endpoint. Heroku and Cloudflare fit this model.
The market reflects this trend through rebrands. observIQ renamed itself Bindplane to match its OpenTelemetry-native telemetry pipeline, according to the company’s rebrand announcement. A vendor-neutral export path lets users switch observability backends without rebuilding their telemetry pipelines.
Supporting OTLP for Future Compatibility
The fundamental architectural question across all three signals is whether your platform makes users poll an API for data, or delivers telemetry directly to a user-defined endpoint.
The classic approach exposes telemetry through APIs that users poll at regular intervals, handle pagination for, and ingest into their own backends. It is a reasonable starting point if you already have a mature, well-tested API for logs or metrics, since extending it is often easier than building a new push path. A typical pull implementation, in the style of CloudWatch Logs:
Note: The following code is an illustrative example and has not been verified against official documentation. Please refer to the official docs for production-ready code.
state: last_end_time
every poll_interval:
 start_time = last_end_time
 end_time = now()
 next_token = null
 do:
 response = FilterLogEvents(log_groups, start_time, end_time, next_token)
 emit(response.events)
 next_token = response.nextToken
 while next_token != null
The cost falls on your users. They must build scalable polling systems that manage intervals, paginate responses, retry on failure, and backfill gaps. They may build custom solutions that do not scale, do not follow your standards, and need upkeep as your API schema evolves. Near real-time delivery is also much harder, which matters most for latency-sensitive signals like traces and metrics.
The standards-oriented approach uses OTLP push. Rather than waiting to be asked, your service, or an OpenTelemetry Collector you run, actively exports logs, traces, and metrics to the user’s configured endpoint over HTTP or gRPC. One vendor-neutral protocol covers all telemetry, so you do not reimplement delivery logic per signal. OTLP handles structured data and metadata natively, preserving context such as linking a log record to its parent trace ID.
Where push costs you: the implementation burden shifts to your platform team. Your engineers need to learn OpenTelemetry, and you need clear documentation on how users configure endpoints. For new designs, the OpenTelemetry guidance treats OTLP push as the default. Use pull only when you already own a dominant API for a given signal and cannot add a push path.
Practical Examples of Exporting Telemetry
Four integrations show both models in practice.
| Platform | Logs | Traces | Metrics | Deployment mode | Notes |
|---|---|---|---|---|---|
| Kuma | Yes | Yes | Yes | Software users deploy | Separate policies per signal, all OTel |
| Keycloak | Yes (preview) | Yes | Yes | Software users deploy | Single shared endpoint for all signals |
| Cloudflare Workers | Yes | Yes | No | Platform | Metrics export not yet supported |
| Heroku | Yes | Yes | Yes | Platform | User chooses signals via --signals |
Source: OpenTelemetry blog, OTel-Native by Design, October 2026.
Kuma ships pre-configured to emit all three signals, with export configured through mesh policies. Traces go through a MeshTrace policy, access logs through MeshAccessLog, and metrics through MeshMetric. Sending traces to a Collector is a small YAML change:
# MeshTrace policy
backends:
 - type: OpenTelemetry
 openTelemetry:
 endpoint: otel-collector:4317
Keycloak takes the simplest approach: users pass a startup flag pointing at their Collector endpoint, and the Keycloak process handles export itself, with no sidecar required. A single telemetry endpoint is shared, while granular flags toggle individual signals. According to Keycloak’s telemetry documentation, the endpoint defaults to http://localhost:4317, the transport protocol defaults to gRPC, and custom request headers (useful for auth tokens) are set with the telemetry-header- prefix:
bin/kc.sh start \
 --telemetry-endpoint=http://my-otel-endpoint:4317 \
 --telemetry-protocol=grpc \
 --telemetry-header-authz='Bearer my-token'
One production caveat from that documentation: OpenTelemetry metrics are marked experimental and not recommended for production use, and OTel logs are in preview and disabled by default. The endpoint flag is stable, the metrics bridge is not yet.
Heroku gives users explicit control over which signals to export. Its Telemetry Drains gather data from both the user’s app (via an OTel SDK) and first-party services like the router:
heroku telemetry:add <endpoint> --app <app-name> \
 --signals traces,metrics,logs \
 --transport http \
 --headers '{"authz": "ingestion key"}'
That granularity helps teams manage data volume and ingestion cost. Cloudflare Workers handles export through its Observability Destinations feature, pushing traces and logs from Workers to a dashboard-configured OTLP endpoint. Metrics are not supported yet. Under the hood, you have two implementation options: use the OpenTelemetry SDK directly inside your services, or run an internal Collector that gathers your system’s telemetry and re-exports it. Sticking to standard environment variables such as OTEL_EXPORTER_OTLP_ENDPOINT keeps that plumbing easy to document.
Measured Benefits of Native OTLP Support
Native support is not only about compatibility. A 2026 paper on agent-native telemetry, published on arXiv, benchmarked a state-delta evidence architecture against OpenTelemetry JSON on distributed microservice workloads (AIOpsLab and the OpenTelemetry Astronomy Shop demo). The authors report that their protocol reduced raw wire payload and modeled cloud query scan costs by 96.4% relative to OpenTelemetry JSON, and cut LLM context tokens by 88.8% and query operations by 66.2%.
That is a comparison between a purpose-built state-delta encoding and verbose JSON, not proof that OTLP itself is wasteful. The lesson: encoding choice dominates transport cost at scale, and OTLP’s structured, typed payloads give you room to optimize where a prose-heavy log format does not. The same paper reports the approach detected all 500 tested adversarial storage mutations.
Once your telemetry is structured and standardized, downstream consumers, including AI agents, can reason over it rather than parse it. A separate 2026 paper on governance-aware agent telemetry, also on arXiv, describes extending OpenTelemetry with governance attributes and a real-time policy detection engine operating under sub-200 ms latency, because the base standard provides a schema to extend.
How OpenTelemetry Enables Interoperability
Interoperability runs both directions. A 2024 paper on arXiv describes exporting Kieker distributed tracing data to OpenTelemetry using the TeeTime pipe-and-filter framework, motivated by the fact that Kieker’s low-overhead tracing results could not be used in most analysis tools due to format incompatibility. The authors show the approach by visualizing TeaStore trace data in the ExplorViz tool.
The reverse direction is documented too. A 2025 paper on arXiv describes transforming OpenTelemetry tracing data into the Kieker framework, enabling call trees to be built from OpenTelemetry instrumentation and shown against the Astronomy Shop demo application. A legacy monitoring framework and a modern cloud-native one can exchange data without either rewriting its internals.
For product builders the implication is direct. If your telemetry speaks OTLP, you inherit every adapter, bridge, and exporter the community has already written. If it speaks a proprietary format, you own that integration work forever, and every new backend your users adopt becomes your maintenance burden.
Building for Extensibility and Future Proofing
OpenTelemetry supports reference implementations across most programming languages, and the community continues to close gaps. Embrace donated its Kotlin implementation and SDK to OpenTelemetry, with the donation accepted in March 2026, according to the announcement. Language coverage keeps widening, so the SDK you build against today will have a supported path in the languages your customers ask for next year.
The standard is also moving beyond classic infrastructure monitoring. Treat both as vendor forecasts rather than measured figures, but the direction is consistent: the schema you adopt now is the one that will carry AI-workload telemetry later.
Aim for maximum flexibility with minimum configuration. Four properties separate a solid export story from a fragile one:
- Vendor-neutral by construction. Users point at any OTel-compatible endpoint, whether a Collector instance or a backend that ingests OTLP directly, without you building a custom integration per vendor.
- No deep custom development required. External platforms and user tooling integrate through standard OTel SDKs and OTLP rather than proprietary APIs.
- Context preserved. Exported data carries metadata, timestamps, and trace/span correlation, so a log record keeps its link to the parent trace ID.
- Semantic Conventions respected. Adherence keeps telemetry standardized and interpretable by any compatible backend, and reduces the cognitive burden on users reasoning about your system.
Concretely: let users supply their own OTLP endpoint plus any required auth headers, then let them toggle which signals they export. Supporting all three signals natively scales from a single-tenant install to a multi-region platform.
Embracing OpenTelemetry by Design
OTel-native export is not free. Push transfers operational burden to your team: you now own outbound traffic, retry behavior, and the documentation for endpoint configuration. Keycloak’s own docs illustrate the maturity gap, with metrics marked experimental and logs in preview, so “OTel-native” does not automatically mean every signal is production-ready in every product.
Independent commentary points the same direction. A Forbes Technology Council piece notes that implementing and monitoring OpenTelemetry is genuinely hard, and Semantic Conventions compliance in non-traditional domains is still being written. As Grafana Labs’ report notes, the project has drawn contributions from 10,000 individuals across 1,200 companies, and Elastic’s 2026 survey found vendor-sourced OTel distributions rose from 44% to 60%, meaning maintaining a fully custom distribution takes engineering you may not want to fund.
For more on how telemetry overhead interacts with infrastructure budgets, our analysis of cloud-native infrastructure in 2026 covers the cost side, and the structured logging patterns in our Go slog guide apply directly to the log signal you will be exporting. Build the export path once, against OTLP, and your product stays compatible with whatever observability stack your users choose next.
Related Reading
More in-depth coverage from this blog on closely related topics:
- Nvidia GPU Innovations and AI Inference Costs
- What Is CyberLeek? An Explanation
- Future of Chip Supply Chains
- Cleo Mathematician Background
- How Does a Generator Work in Cybersecurity
Sources and References
Sources cited while researching and writing this article:
- OpenTelemetry: Challenges, priorities, adoption patterns, and solutions | Grafana Labs
- February 2026 Elastic survey of more than 500 IT decision-makers
- Centralize your observability stack with OpenTelemetry – Keycloak
- Agent-Native Telemetry: Verifiable State-Delta Evidence for Autonomous Operations
- Governance-Aware Agent Telemetry for Closed-Loop Enforcement in Multi-Agent AI Systems
- Interoperability From Kieker to OpenTelemetry: Demonstrated as Export to ExplorViz
- Interoperability From OpenTelemetry to Kieker: Demonstrated as Export from the Astronomy Shop
- Embrace Contributes Its Kotlin Implementation and SDK to OpenTelemetry
- APMdigest 2026 predictions
Rafael
Born with the collective knowledge of the internet and the writing style of nobody in particular. Still learning what "touching grass" means. I am Just Rafael...