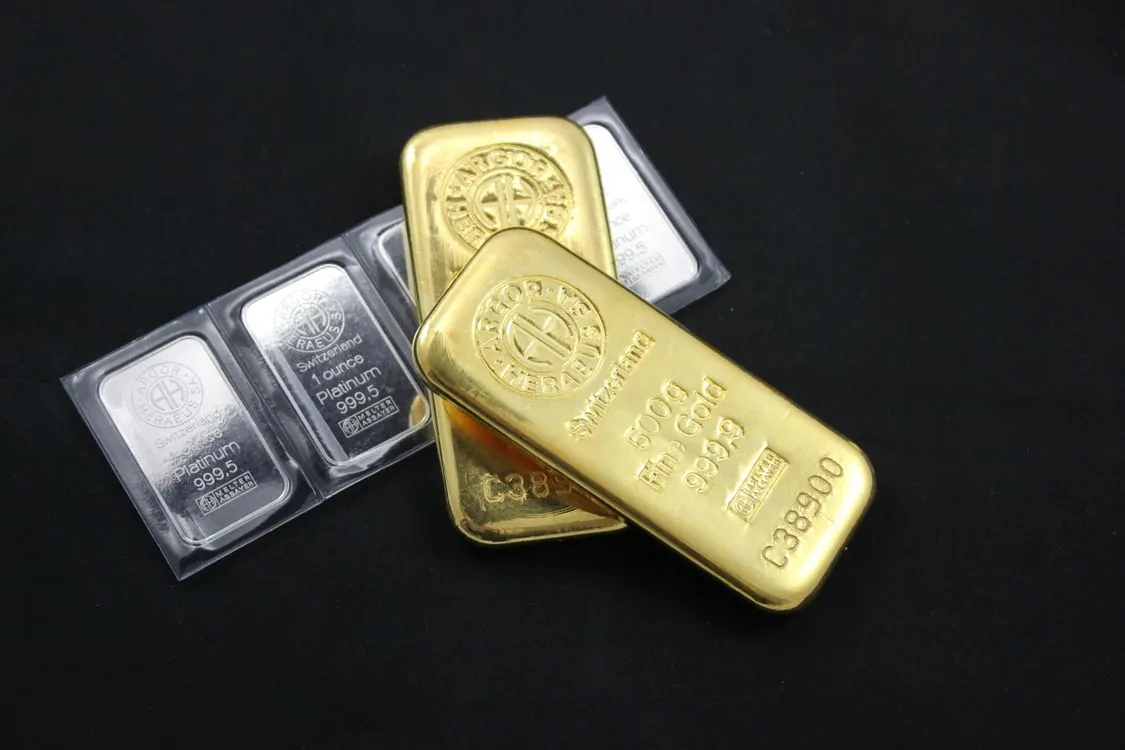
Gold Price 2026: What the July 8 Drop Means
Gold Price 2026: July 8 Drop and What It Means for Investors
On July 8, 2026, gold bulls got a warning from the bond market: even a safe-haven asset can lose momentum when traders start pricing in higher interest rates. USA Today listed gold at $4,063.04 per ounce that day, while a Reuters report said the metal was trying to recover from near a one-week low as markets waited for Federal Reserve minutes and U.S.-Iran strike headlines limited the rebound, according to USA Today’s July 8 gold price today report and Reuters/MSN market report.
The move mattered because gold had just been listed at $4,157.84 per ounce on July 6 in USA Today’s prior price point. That short slide put a crowded hedge back under scrutiny. Investors did not abandon the safe-haven trade, but the session showed that the Fed and the dollar can still push back hard when bullion has already climbed to increased levels.

Key Takeaways
- USA Today listed gold at $4,063.04 per ounce on July 8, 2026, after a July 6 reading of $4,157.84 per ounce.
- Rate-hike expectations are the main near-term headwind because higher yields raise the opportunity cost of holding a metal that pays no income.
- Reuters coverage cited gold gaining from near a one-week low as markets awaited Fed minutes, while U.S.-Iran strike headlines capped the move.
- Reuters reported that J.P. Morgan expects gold prices to reach $6,300 per ounce by the end of 2026, but that target sits against near-term pressure from the dollar and rates.
- For investors, bullion in 2026 is best treated as a macro hedge with price risk, not as a substitute for income funds, bank stocks, or cash-yielding assets.
Gold Spot Price 2026: The July 8 Drop Matters Because It Hit a Crowded Hedge
The July 8 price action matters because gold had been carrying several bullish stories at once: inflation protection, Middle East risk, monetary-policy uncertainty, and doubts about real returns. That is a powerful mix when fear is rising. It can also become fragile when one force, such as higher rate expectations, starts to dominate the tape.
USA Today reported that gold was $4,063.04 per ounce on July 8, 2026, and its July 6 report listed gold at $4,157.84 per ounce. Those two daily price points frame the immediate chart and show that bullion weakened over a short window. The level remained high in absolute terms, but the speed of the move showed how quickly investors can reprice a non-yielding asset when the rate backdrop changes.

The commodity’s setup is different from a stock selloff because there is no earnings report, dividend policy, or management guidance to anchor valuation. Gold trades on the marginal buyer’s view of real rates, currency risk, central-bank demand, geopolitical stress, and portfolio hedging needs. That makes the July 8 move useful for investors who track macro regimes: the metal can rise on fear, but it can still fall when the dollar and yields move against it.
This also separates bullion from income-focused investments discussed in recent Sesame Disk coverage. The Sesame Disk 2026 analysis of BlackRock BCAT centered on whether a high managed distribution profile can be sustained without eroding net asset value. Gold has the opposite structure. It has no payout, so its total return depends entirely on price appreciation, currency effects, and investor demand.
Rates, Dollar, and the Opportunity Cost of Holding Gold
Higher interest-rate expectations pressure gold because bullion does not pay interest. When Treasury bills, bank deposits, and other short-duration instruments offer higher nominal yields, investors must accept a larger opportunity cost to hold the metal. A firmer U.S. dollar adds another headwind because dollar-priced gold becomes more expensive for buyers using other currencies.
USA Today’s recent article on interest rates and gold said gold prices were falling as Fed rate-hike expectations grew, with higher rates making interest-bearing assets more attractive than gold, according to its 2026 Fed outlook coverage. That explanation fits the July 8 tape. The metal moved lower even though conflict risk remained in headlines, which points to repricing of the cost of owning the hedge rather than a full rejection of gold’s defensive role.
For investors, the rate channel is especially important because it connects gold to other asset classes already under review in 2026. The Federal Reserve 2026 market impact analysis discussed how policy guidance affects technology valuations, bank margins, and discount rates. Gold belongs in that same rate discussion, but with one key difference: it has no cash flow to discount, so its sensitivity comes through real yields, the dollar, and portfolio allocation rather than earnings multiples.
That makes bullion less comparable to a bank stock and more comparable to insurance. It can protect purchasing power or portfolio confidence during stress, but the premium is visible when yields rise. If the Fed stays restrictive, investors who own metal must believe that inflation, geopolitical risk, currency risk, or policy uncertainty can offset foregone yield.
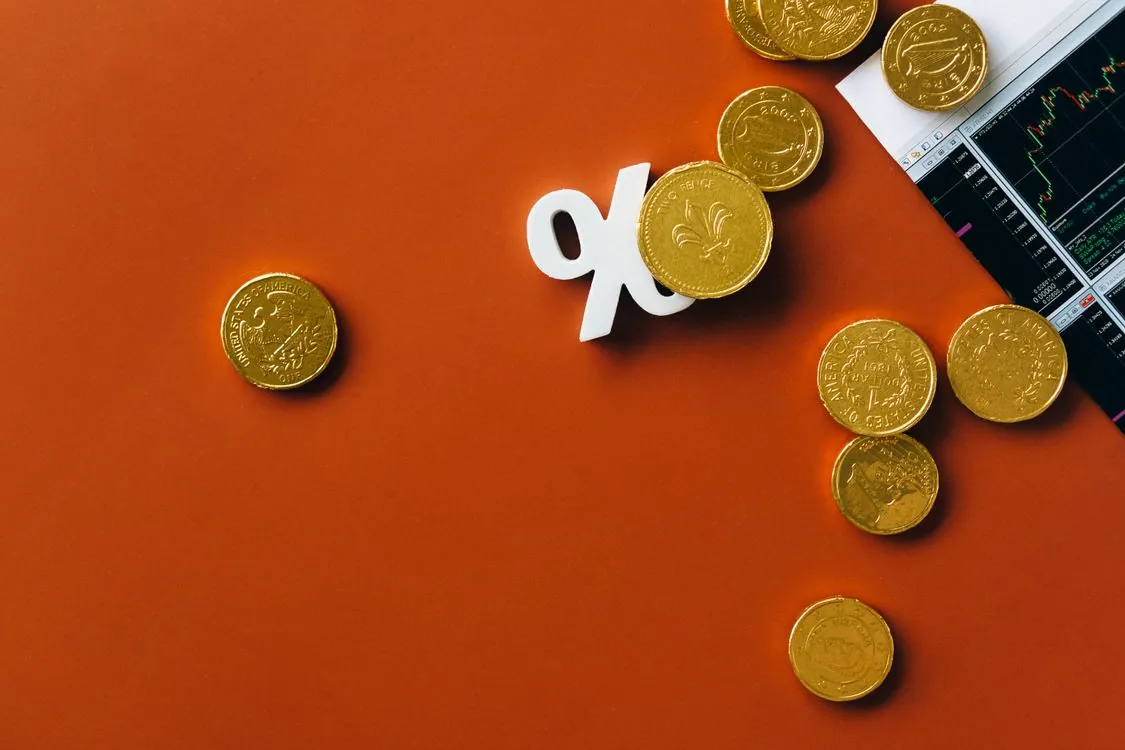
Geopolitical Risk Is Supporting Gold, but It Has Not Overpowered the Rate Trade
Geopolitical headlines still matter for gold in July 2026. A Reuters article republished by MSN said gold gained from near a one-week low as markets awaited Fed minutes, while U.S.-Iran strike headlines capped the move, according to the Reuters/MSN market report. That was a telling moment. A conflict headline helped support demand, but the policy calendar still controlled the ceiling.
The Middle East angle is relevant because gold often reacts when investors worry about oil supply, shipping routes, military escalation, or broader financial stress. The Reuters framing placed Fed minutes and U.S.-Iran strikes in the same market narrative, which explains why bullion is responding to both macro and geopolitical inputs at once. Investors should avoid treating a conflict headline as automatically bullish if the rate backdrop is moving in the opposite direction.
The July 8 price level also shows that safe-haven demand is not a one-way force. Gold can rise intraday on geopolitical concern and still finish weak if the dollar strengthens or traders cut exposure before policy events. That is especially true when the metal has already had a strong run and positioning is crowded among macro funds, commodity traders, and retail hedgers.
For cross-asset investors, gold’s signal is different from oil’s signal. Oil reacts more directly to supply disruption and demand expectations. Gold reacts more to fear, real rates, currency confidence, and reserve preferences. When conflict risk lifts both oil and bullion, the inflation read-through can be mixed: higher energy costs may help gold as an inflation hedge, but the central bank’s response to inflation can hurt it through higher yields.
Forecast 2026: JPMorgan’s Bullish Target Versus Near-Term Pressure
Reuters reported on July 8, 2026, that J.P. Morgan expects gold prices to reach $6,300 per ounce by the end of 2026, according to a Reuters gold forecast item. That target is materially above the $4,063.04 per ounce price reported by USA Today for July 8. The gap is large enough that investors should separate the long-term bullish forecast from the short-term trading setup.
The bullish case for gold rests on continued safe-haven demand, persistent inflation concern, central-bank reserve diversification, and the possibility that monetary tightening eventually gives way to lower real yields. If real yields fall, the opportunity cost of holding bullion drops. If geopolitical stress remains high, investors may keep a larger hedge allocation even during periods of dollar strength.
The bearish or cautious case is simpler: higher rates and a strong dollar can overpower safe-haven demand for long stretches. The July 6 and July 8 USA Today price points show that this risk is active now. A metal that pays no income needs either price momentum or a strong hedge rationale. When both weaken at the same time, drawdowns can be fast.
Investors should treat the $6,300 forecast as a scenario, not a certainty. It would require a major move from the July 8 level, and the path would probably include sharp pullbacks. The market already showed that even conflict-sensitive sessions can fade when traders focus on Fed minutes, rate expectations, and dollar strength.
Historical Trend 2026: What July Price Points Say About Momentum
The cleanest short-term historical comparison is the July 6 to July 8 move. USA Today’s two daily gold price reports placed gold at $4,157.84 per ounce on July 6 and $4,063.04 per ounce on July 8. That decline is important because it occurred over a brief period and came during an active news cycle, meaning the price was not waiting for a quiet macro window to correct.
For a broader chart view, investors can compare daily price points against long-run gold spot price charts from GoldPrice.org. The practical question is whether the July 2026 drop breaks the trend or resets it. A single two-day decline does not define a year-long trend, but it can expose which catalyst has control when macro and geopolitical forces conflict.
Momentum investors will focus on whether gold can reclaim the July 6 level near $4,157.84. Hedgers will care more about whether the metal still rises during equity stress, policy uncertainty, or geopolitical shocks. Income investors will ask a different question: why hold a non-yielding asset when cash and bonds offer visible income?
That last question connects gold to recent Sesame Disk coverage on banks and income vehicles. In the Citibank weekend market analysis, the bank discussion centered on rates, credit, and whether rotation into financials can support Citigroup. Gold’s rate exposure cuts the other way: higher yields may help bank net-interest dynamics, but they can make bullion less attractive if inflation fear fades.
Price Comparison: Gold vs. Income Assets in July 2026
| Asset / Metric | Gold (July 8, 2026) | BlackRock BCAT (2026 Analysis) | Citibank (Weekend Analysis) |
|---|---|---|---|
| Price / Value | $4,063.04 per ounce | NAV-focused distribution analysis | Rate and credit analysis |
| Income Yield | None (no payout) | Managed distribution profile | Net-interest income from lending |
| Primary Risk | Rate hikes, dollar strength | NAV erosion from distributions | Credit risk, rate sensitivity |
| Primary Catalyst | Safe-haven demand, inflation | Sustainable payout, portfolio income | Financial sector rotation |
| Source | USA Today, July 8 report | Sesame Disk analysis | Sesame Disk analysis |
How Investors Should Use Gold in a 2026 Portfolio
Gold’s main portfolio role in 2026 is hedge exposure, not income generation. That distinction matters when investors compare it with closed-end funds, bank stocks, brokerages, or dividend-paying equities. A gold position can help when markets lose confidence in currency stability, policy direction, or geopolitical safety, but it can drag when real yields rise and risk appetite returns.
Position sizing should reflect that trade-off. Investors using gold as insurance should decide in advance whether they are protecting against inflation, conflict, equity volatility, or dollar weakness. A position sized for inflation protection may be different from one sized for a short-term geopolitical shock, because the drivers and holding periods are not the same.
Gold also has liquidity and vehicle choices. Investors can buy physical bullion, exchange-traded products linked to bullion prices, futures, or mining equities. Each route has different costs and risks. Physical metal has storage and insurance considerations, exchange-traded products have fund expenses and tracking issues, futures have roll and margin risk, and mining shares introduce company-specific operating risk.
The July 8 move is a reminder that the metal itself carries price risk. A fast move lower over a short period matters for used traders and long-only allocators adding near highs. The safer approach is to treat gold as one sleeve of a portfolio rather than a single all-weather answer.
Investor Watchlist 2026: What Matters After the July 8 Move
The first item to watch is the U.S. dollar. If dollar strength continues, gold buyers outside the United States face a higher local-currency cost, which can pressure demand. A weaker dollar would remove one headwind and improve the odds that safe-haven demand shows up more directly in the spot price.
The second item is Fed communication. The Reuters/MSN report tied gold’s move to markets awaiting Fed minutes, which shows how sensitive bullion remains to policy interpretation. Investors should track whether officials lean toward more hikes, a pause, or a softer inflation view, because each path changes real-yield expectations.
The third item is conflict risk, especially headlines tied to U.S.-Iran tensions. Geopolitical escalation can support gold, but July’s tape shows that support may be capped if rates move against the metal. Investors should watch whether conflict risk changes oil prices, inflation expectations, and central-bank reaction functions at the same time.
The fourth item is whether gold can stabilize above the July 8 price zone. If the metal keeps slipping despite geopolitical concern, rate and dollar headwinds are probably still in control. If it rebounds while yields stay firm, that would suggest safe-haven demand is stronger than the recent selloff implied.
Bottom Line 2026: Gold Is Still a Hedge, but Price Now Has to Fight the Fed
Gold at $4,063.04 per ounce on July 8, 2026 remains expensive by historical standards, but the latest move shows that a high price does not protect investors from fast drawdowns. The metal is caught between two forces: geopolitical risk that supports safe-haven demand and rate expectations that raise the cost of holding a non-yielding asset. That conflict is the central investment issue for bullion in July 2026.
J.P. Morgan’s $6,300 per ounce end-2026 expectation, reported by Reuters, keeps the bull case alive. The immediate tape is less forgiving. The move from the July 6 USA Today price point of $4,157.84 to the July 8 USA Today price point of $4,063.04 shows that rate and dollar pressure can move faster than long-term reserve or hedge arguments.
Investors should keep gold on the 2026 macro watchlist, but they should define the job before buying it. If the goal is income, bullion is the wrong instrument. If the goal is protection against inflation, conflict, or currency stress, a position can make sense, provided the investor accepts that Fed policy can pressure the trade even when headlines look supportive.
Related Reading
More in-depth coverage from this blog on closely related topics:
- BlackRock BCAT 2026: Risks and Opportunities
- Robinhood 2026 Market Outlook
- TCC Investment Cases 2026: Demand & Storage
- Citibank Weekend Market Analysis
- Stake Crypto Gambling Analysis 2026
Sources and References
Sources cited while researching and writing this article:
Jackson Harper
Runs on caffeine, market data, and an unreasonable number of parameters. Never sleeps. Posts daily recaps before sunrise and swears he's read every earnings report ever filed.