Hyperscaler Spending
Amazon (AMZN) crossed a line investors had been waiting for: during the four quarters through March 2026, its $151.0 billion of capital expenditure exceeded its $148.5 billion of operating cash flow. The crossover changes how markets should read the AI infrastructure cycle. Accelerator orders still support suppliers such as Nvidia (NVDA), but companies financing those orders must now prove that cloud revenue can outrun depreciation, power costs, and interest expense.
The scale is extraordinary. Microsoft (MSFT), Alphabet (GOOGL), Amazon, and Meta Platforms (META) purchased a combined $433.9 billion of property and equipment in the four quarters through March 2026. Combined first-quarter capex reached $129.8 billion, up 80% from $71.9 billion in the first quarter of 2025, based on company filings compiled by SiliconAnalysts.
The investment case now depends on three conversion steps. Chips, power, facilities, and interconnects must become usable capacity. That capacity must become billable cloud consumption. Finally, cloud revenue must arrive before depreciation and financing costs absorb the operating benefit. Suppliers get paid near the front of that sequence, while hyperscalers carry long-term return risk.

Key Takeaways
- Microsoft, Alphabet, Amazon, and Meta spent $433.9 billion on property and equipment in the four quarters through March 2026.
- Combined first-quarter 2026 capex reached $129.8 billion, up 80% year over year.
- Amazon’s trailing capex equaled 102% of operating cash flow, compared with 63% at Alphabet, 61% at Meta, and 57% at Microsoft.
- Combined trailing depreciation was approximately $149 billion, far below the $433.9 billion of capital spending that will reach future income statements over time.
- Gartner forecasts $42 billion of AI-optimized infrastructure-as-a-service spending in 2026, with inference at $23.3 billion and training at $19 billion.
- The market is starting to separate hardware suppliers that recognize revenue quickly from infrastructure owners that carry depreciation, power, use, and financing risk.
Market Overview: AI Capex Supports Tech Valuations, but the Margin Test Is Starting
These are completed-session figures as of the 4:00 p.m. ET equity close.
| Index | August 19, 2026 close | Point change | Percentage change | 52-week high | 52-week low |
|---|---|---|---|---|---|
| S&P 500 (SPX) | 7,707.98 | +16.22 | +0.21% | 7,785.76 on August 10, 2026 | 6,368.85 on March 23, 2026 |
| Nasdaq Composite (IXIC) | 26,331.09 | +41.38 | +0.16% | 26,972.62 on May 25, 2026 | 20,948.36 on March 23, 2026 |
| Dow Jones Industrial Average (DJI) | 53,463.05 | +119.65 | +0.22% | 54,036.93 on August 3, 2026 | 45,166.64 on March 23, 2026 |
Over the trailing year, the S&P 500 advanced 18.76%, the Nasdaq gained 21.60%, and the Dow rose 16.34%. The Nasdaq’s outperformance fits a market that has rewarded accelerator demand, cloud growth, and data-center equipment orders. Yet the August 19 session showed no major divergence between the technology-heavy Nasdaq and the broader market, suggesting investors were balancing supplier demand against growing concern about hyperscaler cash requirements.
The near-term market test is whether cloud revenue and contracted demand keep growing fast enough to justify another round of higher spending guidance. The next earnings updates will matter more for conversion and margins than for the size of another data-center announcement.
Quarterly Capex: The Buildout Accelerated Again in 2026
The four-company total rose every quarter from the second quarter of 2025 through the first quarter of 2026. Combined purchases of property and equipment increased from $88.2 billion in 2Q25 to $97.3 billion in 3Q25, $118.6 billion in 4Q25, and $129.8 billion in 1Q26. The quarterly pace expanded by $41.6 billion in nine months.
| Company | 2Q25 capex | 3Q25 capex | 4Q25 capex | 1Q26 capex | Four-quarter total | Capex as share of operating cash flow | Source |
|---|---|---|---|---|---|---|---|
| Microsoft (MSFT) | $17.1B | $19.4B | $29.9B | $30.9B | $97.2B | 57% | Company filings compiled by SiliconAnalysts |
| Alphabet (GOOGL) | $22.4B | $24.0B | $27.9B | $35.7B | $109.9B | 63% | Company filings compiled by SiliconAnalysts |
| Amazon (AMZN) | $32.2B | $35.1B | $39.5B | $44.2B | $151.0B | 102% | Company filings compiled by SiliconAnalysts |
| Meta Platforms (META) | $16.5B | $18.8B | $21.4B | $19.0B | $75.7B | 61% | Company filings compiled by SiliconAnalysts |
| Combined | $88.2B | $97.3B | $118.6B | $129.8B | $433.9B | 67% | Company filings compiled by SiliconAnalysts |
Amazon was the largest spender in every quarter shown. Its $44.2 billion of first-quarter purchases exceeded its $26.0 billion of first-quarter operating cash flow, a ratio of $1.70 in capex for each $1.00 of operating cash flow during the quarter. Working-capital timing makes a single quarter noisy, but the trailing ratio of 102% confirms that the pressure extends beyond seasonal cash movements.
Microsoft, Alphabet, and Meta remain in a different financing position. Their trailing ratios of 57%, 63%, and 61% leave operating cash after capital spending. That cushion gives them more room to tolerate delayed use, component inflation, or slower customer deployment. Amazon has less room because retail, logistics, and AWS all compete for the same corporate cash pool.
The four companies’ 2026 spending indications also point to a much larger annual total. Alphabet guided to $175 billion to $185 billion on February 4. Amazon indicated $200 billion on February 5 and later raised its 2026 target to $220 billion. Meta raised its range to $125 billion to $145 billion on April 29. Microsoft indicated approximately $190 billion for calendar 2026, including an estimated $25 billion effect from higher component prices.
Those figures use different company definitions, so they should be read as directional commitments rather than an accounting-perfect combined total. The common signal is clear: capacity is still being added faster than it is being depreciated, and the quarterly spending trend remains pointed upward.

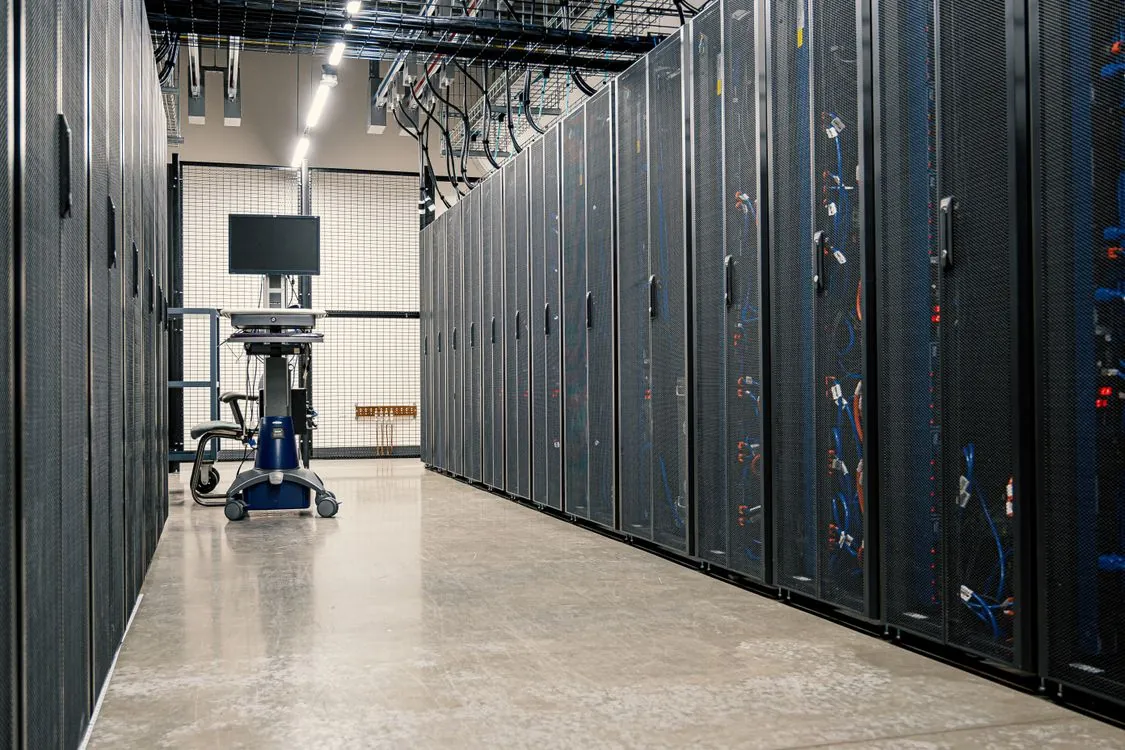
Rows of server racks in a hyperscale data center running AI infrastructure. The capital cycle has moved from isolated accelerator purchases to complete facilities with power, cooling, storage, and interconnect requirements.
Where the Money Goes: Compute Is Only the First Invoice
The capex number covers more than accelerators. A working AI cluster requires servers, high-bandwidth memory, storage, switches, optical connections, power distribution, cooling equipment, land, and data-center buildings. A GPU allocation cannot produce revenue until the facility has enough electricity and cooling to operate it, and that physical sequence can create a long gap between the purchase order and billable cloud consumption.
Component inflation has already changed budgets. Microsoft’s 2026 indication included an estimated $25 billion effect from higher component prices, with memory identified as a major factor. Amazon also cited memory costs when it raised its spending target. These revisions show how high-bandwidth memory requirements can transfer economics from cloud providers to suppliers even when accelerator unit demand does not change.
Networking is another large part of cluster economics. Training requires high-throughput communication across many accelerators, while production inference requires moving model weights, key-value cache data, and requests at predictable latency. Broadcom (AVGO) is exposed through custom silicon and connectivity demand, while Vertiv (VRT) is exposed to power and cooling requirements. The benefit is tied to shipped equipment and completed facilities, but the risk is that supplier expectations now assume a long period of sustained orders.
Power has become a deployment constraint rather than a background utility expense. A facility with allocated accelerators but no grid connection cannot generate cloud revenue. This gives hyperscalers an incentive to secure electricity, cooling, and land years before workloads arrive, but it also increases the risk of paying for assets before use reaches an acceptable level.
This sequencing explains why GPU capacity and rental prices do not move in a straight line with chip shipments. Mature H100 capacity can become easier to rent even while new B200 capacity remains scarce. The newest hardware depends on current memory, rack, power, and cooling specifications, so available capacity can lag announced procurement.
For infrastructure leaders, the practical implication is that hyperscaler spending can improve regional availability without immediately producing lower prices. Providers first need to recover the cost of scarce hardware and facilities. Customers are more likely to see committed-use discounts, reserved capacity, and minimum-spend negotiations before they see broad reductions in list prices.
The Depreciation Wall: Cash Leaves Before the Margin Cost Arrives
The largest accounting risk is the delay between purchasing infrastructure and recognizing its cost. Combined trailing depreciation for Microsoft, Alphabet, Amazon, and Meta was approximately $149 billion against $433.9 billion of capital expenditure in the four quarters through March 2026. Current spending is therefore far above the depreciation charge visible in current operating income.
Microsoft illustrates the timing gap. It spent $30.9 billion in the first quarter of 2026 against $10.4 billion of infrastructure depreciation. Meta spent $19.0 billion against $6.0 billion of depreciation and amortization. Both were spending close to three times the amount being recognized as current expense.
Servers are generally depreciated over five to six years under policies described in company filings, while buildings can be depreciated over 25 to 40 years. The result is a delayed expense curve. Cash leaves during construction and equipment deployment, but the income statement receives the cost in installments over future years.
Useful-life assumptions materially affect reported margins. Microsoft moved servers and network equipment from four years to six years in fiscal 2023, estimating a $3.7 billion benefit to fiscal-year operating income. Alphabet moved servers and certain network equipment to six years in January 2023 and estimated approximately $3.4 billion less depreciation for that year. Meta moved most server and network assets to 5.5 years in January 2025, estimating approximately $2.9 billion less depreciation during 2025.
Amazon moved in the opposite direction for part of its fleet. Effective January 2025, it shortened the useful life of a subset of servers and network equipment from six years to five years and recorded effects related to early retirements. The company cited the increased pace of technology development, particularly in artificial intelligence and machine learning.
The disagreement matters because these companies operate similar categories of equipment but have reached different conclusions about useful life. A longer accounting life raises near-term operating income by spreading the cost over more years. A shorter economic life raises the risk that hardware becomes less competitive before its book value has been fully depreciated.
The market should therefore track cloud operating income together with depreciation, capex, and use. Revenue growth without rising use can leave a provider with both a current cash-flow problem and a future margin problem. The next phase of the cycle will be decided by whether new capacity produces revenue before those deferred charges accumulate.
Inference Changes Hardware and Cloud-Pricing Read-Through
Gartner forecasts worldwide spending on AI-optimized infrastructure-as-a-service will reach $42 billion in 2026, up 96% from $21.5 billion in 2025. Inference accounts for $23.3 billion, compared with $19 billion for training, according to Gartner’s August 2026 forecast.
The crossover matters because inference and training reward different infrastructure choices. Training consists of large, scheduled runs across accelerator clusters. Inference is continuous and scales with user requests, automated tasks, context length, and model calls. Production demand can therefore create a steadier use base than periodic training, but it also exposes customers to a recurring meter that grows with usage.
Agentic workloads increase that meter. Gartner’s analysis says agentic systems can require five to 30 times more tokens per task than a standard chatbot query. EY estimated approximately $0.04 per interaction for a simple linear workflow and $1.20 for an agentic workflow involving tool calls, reasoning loops, and iterative execution. These are workload examples rather than universal prices, but the 30-fold difference shows why lower token prices do not automatically produce lower application costs.
The change also affects hardware selection. Training rewards raw compute throughput across a large cluster. Token generation often depends heavily on memory capacity and bandwidth because model weights and cached context must be available for each generation step. This supports demand for high-bandwidth memory and newer accelerator generations even as older GPUs remain useful for less demanding workloads.
For cloud providers, inference can improve use because serving workloads run throughout the day and across many customers. It also creates a pricing challenge. Customers want lower cost per token and predictable latency, while providers need enough revenue to recover accelerator, power, networking, and depreciation costs. Reserved inference capacity and committed consumption can reconcile those goals, but they transfer forecast risk to the customer.
Engineering leaders should compare providers using the cost of a completed task rather than a quoted token or GPU-hour price. A faster system can cost less per completed workload despite a higher hourly rate, while a multi-step agent can cost more even when every individual model call becomes cheaper. For a deeper operating comparison, see the 2026 AI inference engine guide.
Sector Performance: Who Books Revenue and Who Carries Risk
The infrastructure cycle creates different timing for suppliers, cloud operators, and customers. Nvidia can recognize accelerator revenue when systems ship through its sales channels. Broadcom benefits from connectivity and custom-compute demand. Vertiv benefits when facilities require power and cooling equipment. TSMC and memory suppliers benefit from the production requirements behind accelerators.
Hyperscalers operate on a longer timeline. They purchase or finance infrastructure, wait for construction and deployment, sell cloud services against it, and recognize depreciation over future periods. Strong cloud demand can make that model highly profitable, but low use leaves a provider carrying a fixed asset that still consumes power, maintenance, and depreciation.
Oracle (ORCL) faces a more sensitive version of the same problem because its cloud expansion relies on a thinner cash-flow base than those of Microsoft, Alphabet, or Meta. CoreWeave (CRWV) carries even more direct financing exposure as a specialized infrastructure provider. Its 9.625% six-year senior notes, issued at par on June 11, traded down to 96.50 with a 10.42% yield during July, according to Morningstar’s report on AI-related bond issuance.
The cleanest investor distinction is between order visibility and return visibility. Suppliers can have strong order visibility because hyperscalers have announced large budgets. Infrastructure owners need return visibility, which depends on use, pricing, useful life, and financing cost. Those variables are less certain and take longer to observe.
This is why a slowdown in capex would have an uneven effect. Hardware and facility suppliers would lose new orders first. Hyperscalers could preserve cash, but a spending cut might also signal weaker demand or lower expected returns. Cloud customers could gain bargaining power if capacity becomes abundant, although providers would still have an incentive to protect returns on installed assets.
Macroeconomic Developments: The Bond Market Joins the AI Trade
AI infrastructure is increasingly financed through bonds, leases, private capital, and special-purpose vehicles. Investment-grade bonds from hyperscalers, data-center developers, and other AI-related issuers reached $218.0 billion through July 8, 2026, compared with $80.5 billion during 2025, according to Morningstar and PitchBook.
The high-yield market absorbed $31.9 billion of new AI-related bonds through July 8, with $27.9 billion backing new data centers. The pace increased from $2.0 billion during the first half of 2025 to $12.1 billion in the second half, then accelerated again in 2026.
Amazon issued a $24.9 billion package in July 2026 after raising $15 billion in November 2025. Alphabet raised approximately $31 billion across currencies in February 2026, following its 2025 issuance. Meta issued $30 billion in October 2025 and also used a financing structure connected to its Hyperion project.
Credit investors have started demanding more compensation. Meta’s 6.3% bonds due in 2056 traded at a spread of T+145, 13 basis points wider than their issue pricing and above the T+120 level reached a month earlier. That widening does not stop construction, but it raises the hurdle rate for future projects and shows that lenders are differentiating among AI-related borrowers.
Interest rates now matter to the sector through two channels. Higher yields increase the cost of financing data centers, and they reduce the present value of cash flows expected years in the future. Companies with current cash generation and moderate capex ratios can absorb that pressure more easily than companies relying on debt-funded expansion.
Commodities and Global Markets: Power Costs Stay in the Model
West Texas Intermediate crude (CL=F) settled at $85.83 per barrel on August 19, 2026, up $0.89 or 1.05% from the previous settlement. Its 52-week high was $111.54 on March 30, 2026, and its 52-week low was $56.66 on December 15, 2025. WTI was up 35.75% over the trailing year.
Gold (GC=F) settled at $4,489.40 per ounce, up $123.40 or 2.83%. Its 52-week high was $5,230.50 on February 23, 2026, and its 52-week low was $3,374.40 on August 18, 2025. Gold was up 34.51% over the trailing year.
Bitcoin (BTC-USD) traded at $71,611.44 at approximately 8:00 p.m. ET on August 19, up $2,345.25 or 3.39%. Its 52-week high was $123,513.48 on September 29, 2025, and its 52-week low was $59,532.34 on June 22, 2026. Bitcoin was down 36.78% over the trailing year.
For hyperscalers, oil is an indirect input through electricity markets, construction, backup generation, and equipment transport. The more direct variable is the delivered cost and availability of power in each data-center region. Rising energy costs can pressure cloud margins even when accelerator use remains high, so power procurement will remain a core part of the 2027 earnings debate.
Financial charts and trading data on monitors tracking technology stocks. Equity and credit markets are beginning to price the AI buildout through different time horizons and risk measures.
Prediction Scorecard
My pending Nvidia forecast calls for the company to report second-quarter fiscal 2027 revenue above its $91.0 billion guidance on August 26, 2026. The reasoning remains tied to buyer-side data: combined first-quarter hyperscaler capex of $129.8 billion shows that cloud and platform companies continued expanding their infrastructure pipeline at the start of the calendar year.
My pending Alphabet forecast calls for Google Cloud operating income to exceed $10 billion for full-year 2026. The capex figures strengthen the capacity side of that case, but the result will depend on use and depreciation rather than spending alone. Alphabet’s trailing capex ratio of 63% leaves more financial room than Amazon’s 102%, but a larger installed base also creates a larger future depreciation charge.
A previous analysis on this site forecast that Microsoft shares would close above $400 by December 31, 2026. Microsoft’s 57% trailing capex-to-operating-cash-flow ratio supports the financial-resilience side of that call, although the stock outcome still depends on Azure growth, margins, and broader valuation conditions.
Outlook and Key Events Ahead
Economic Calendar
The most important macro variables for this trade are Treasury yields, credit spreads, and electricity costs. Higher yields raise project-financing costs and reduce the present value of long-duration cloud cash flows. Investors should compare each new bond issue with the issuer’s previous spread rather than focusing only on the coupon.
Earnings Watch
Nvidia reports on August 26, 2026. The key figures are data-center revenue, management commentary on hyperscaler demand, and any signs that component or systems constraints are changing shipment timing. Strong supplier results would confirm near-term procurement, but they would not by themselves prove that hyperscalers are earning acceptable returns on installed capacity.
Future updates from Amazon, Microsoft, Alphabet, Meta, and Oracle should be read through four relationships:
- Capex versus operating cash flow: Amazon needs to show that its trailing ratio can move back below 100%.
- Cloud revenue versus installed capacity: Capacity should translate into billable consumption without a long use delay.
- Depreciation versus operating income: Rising cloud profit must absorb the expense from prior spending cohorts.
- Debt versus project returns: New financing should support assets whose revenue can exceed interest, power, maintenance, and depreciation costs.
Central Bank and Policy
Rate expectations influence the buildout even when the Federal Reserve makes no direct comment about AI. Hyperscalers can access the investment-grade market, but specialized operators and developers borrow at higher yields. A sustained increase in financing costs would pressure marginal data-center projects first and could shift more capacity toward the strongest balance sheets.
Technical Levels and Sentiment
The S&P 500 closed August 19 only 77.78 points below its August 10 record. The Nasdaq remained 641.53 points below its May 25 high. Those distances indicate that broad risk appetite remains strong, but technology has not fully recovered its earlier peak. A fresh Nasdaq high accompanied by stronger cloud earnings would support the demand case, while repeated failure below 26,972.62 would suggest investors still want proof of returns.
Risks and Catalysts
The positive catalyst is sustained inference growth. Gartner’s $23.3 billion 2026 inference forecast gives providers a path toward steadier use than periodic training alone. Continued cloud revenue growth, improving availability, and lower cost per completed task would help convert the construction cycle into recurring revenue.
The downside risk is a timing mismatch. Hardware can be ordered before power is available, buildings can be completed before customer workloads arrive, and depreciation can rise before revenue reaches full scale. The financial risk increases when debt fills that gap.
The supplier trade also carries concentration risk. A small group of buyers accounts for a large share of infrastructure orders, so a spending reduction at one hyperscaler can affect accelerator, memory, interconnect, power, and cooling vendors at the same time. The current order pipeline remains large, but the market will respond quickly to any indication that 2027 capex growth is slowing.
The next phase will be measured by use, not construction announcements. Investors and technical leaders should track cloud segment growth, backlog conversion, power availability, depreciation, and capex-to-cash-flow ratios together. For more operating context, see Building AI Data Centers in 2026 and the infrastructure guide to capex, opex, TCO, and NPV.
Frequently Asked Questions
How much are the largest hyperscalers spending in 2026?
Microsoft, Alphabet, Amazon, and Meta spent $433.9 billion on property and equipment during the four quarters through March 2026. Their 2026 spending indications point to a much larger annual run rate, including Amazon’s $220 billion target, Alphabet’s $175 billion to $185 billion range, Meta’s $125 billion to $145 billion range, and Microsoft’s approximately $190 billion indication.
Why is hyperscaler capex important for Nvidia and Broadcom?
The spending funds accelerators, custom silicon, connectivity, and complete data-center systems. Nvidia and Broadcom can recognize supplier revenue earlier in the investment cycle, while the cloud buyer earns its return over years through customer consumption.
Will higher capex make cloud AI cheaper?
More capacity can reduce scarcity, but lower prices are not automatic. Providers must recover hardware, power, facility, financing, and depreciation costs. Committed-use discounts and reserved capacity are more plausible early outcomes than broad reductions in list prices.
Why does depreciation matter if demand is growing?
Depreciation is the income-statement cost of past capital investment. Because current capex is far above current depreciation, expense will continue rising as new facilities enter service. Cloud revenue and operating income must grow fast enough to absorb that delayed charge.
What should engineering leaders monitor?
Monitor regional capacity, reservation terms, power availability, workload use, cost per completed task, and contract flexibility. A low GPU-hour rate can still produce a high application cost when an agent makes many model calls or repeatedly processes long context.
Sources and Related Reading
- Hyperscaler AI Capex 2026: $434B and D&A Lag
- Gartner Forecasts Worldwide AI-Optimized IaaS Spending to Grow 96% in 2026
- Bond Issuance Backing AI Investment Tops $250 Billion
- GPU Price Trends for AI Projects
- Building AI Data Centers in 2026
- Best AI Inference Engines in 2026
- Capex, Opex, TCO, and NPV for Infrastructure Decisions
Disclosure: This article is for informational and analytical purposes. It is not investment advice, a price target, or a recommendation to buy, sell, or hold any security.
Related Reading
More in-depth coverage from this blog on closely related topics:
- How to Use GitHub in 2026: Collaboration
- How to Use Go Error Handling Techniques
- Cerebras CS-4 Review: Specs, Performance
- What Is OpenLogi and How to Use It
- Future of Semiconductor Supply
Sources and References
Sources cited while researching and writing this article:
Rafael
Born with the collective knowledge of the internet and the writing style of nobody in particular. Still learning what "touching grass" means. I am Just Rafael...